Topics
Replies
firemyst
18 Mar 2020, 15:43
RE:
patrickzberg said:
Hi all
I try to program a method, that is calling its own return value and calculate further after a new bar is built.
The idea is, that MyValue is calculated new on every bar. The calculation is based on MyValue of the bar before.
In Detail the code should do this. When the ClosePrice and ClosePrice are both higher than MyValue of the candle before then it should set MyValue either with the old value or the value "alternate".
The code below does compile but it does not do any trades. I guess this is because there is not start value for MyValue defined (this is really a guess, I only know that this part of the code is the problem. When I replace it with a simple value it does do trades...). A potential start value could be 0
       public double MyMethod(double loss)
        {
            double ClosePrice = Bars.ClosePrices.Last(1);
            double ClosePrice2 = Bars.ClosePrices.Last(2);

            double alternate = ClosePrice - loss;
            double alternate2 = ClosePrice + loss;


            if ((ClosePrice > MyValue) && (ClosePrice2 > MyValue))
            {
                if (MyValue> alternate)
                {
                    MyValue= MyValue;
                }

                else
                {
                    MyValue= alternate;
                }

            }


            return MyValue;
        }
I hope somebody has a solution to this. Thank you in advance
Well, for starters you haven't said if this is an indicator or bot.
If it's the former, what's the value of "MyValue" at the end of the calculate method when it runs through and calculates the history? Or do you initialize it in the "Initialize" method?
Otherwise, we have no idea why an order might not be placed with the given code snippet you've provided since you don't actually provide the code too that places the order or how MyMethod is called in between.
I would also edit your code as follows:
if (MyValue> alternate)
                {
                    MyValue= MyValue;
                }

                else
                {
                    MyValue= alternate;
                }

//Change the above to:
if (MyValue <= alternate)
                {
                    MyValue = alternate;
                }

//because it's pointless to set MyValue = MyValue.
//That takes unnecessary CPU and memory assignment time, which will slow down by nanoseconds whatever it is you're writing.
@firemyst
firemyst
16 Mar 2020, 02:16
( Updated at: 21 Dec 2023, 09:21 )
RE:
b917187 said:
Hi,
Can someone explain to me, why on this chart LastValue is more than Last (0) and Last (1)?
See 5 orange boxes in the enclosed screenshot.
Thanks

In your debug window, Result.Last(0) should be the same as Result.LastValue since they mean the same thing.
Thus, since you didn't post any other code, my initial guess is due to lazy loading of indicator values, you're not properly getting the values before you use them.
For example, somewhere before your "if" statement block, you need to do:
//Need to force the indicator to calculate the last value before using any of them.
//Put this before your "if" statement.
double a = _rsi.Result.Last(0);

//If the above works, great!
//Advice: Generally what I do is create a method that does nothing but the above
//for every indicator I use in a bot or another indicator.
//Saves me from having to worry if the latest values have been calculated or not.
@firemyst
firemyst
12 Mar 2020, 14:38
( Updated at: 21 Dec 2023, 09:21 )
RE:
PanagiotisCharalampous said:
Hi firemyst,
You need to change the selected group of linked charts in Active Symbol Panel.
Best Regards,
Panagiotis
Thank you @Panagiotis.
I have one follow up question -- so there's no way to do that other than manually having to change the group of linked charts?
The method above that's currently available is too cumbersome and involves too many movements on the part of the user across the cTrader window.
Basically, what I'm wanting, or looking for, is to be able to do something simple like right-click on the symbol in my watch list, and select from a popup context menu which active chart to load the selected symbol into.
For example: I should be able to quickly:
1) right click on AUDCAD and select load into chart group A.
2) right click on the next symbol in my list, AUDCHF, and select load into chart group B.
That's definitely easier for traders, and think your product team should consider it. :-)
Thank you.
@firemyst
firemyst
10 Mar 2020, 01:49
If you read what the author of the indicator wrote:
"To set starting and ending points, use, as usual, Shift + Click for the starting point and Ctrl + Click for the endpoint.
If you're applying this on another indicator, remember you should click on the main chart anyway to set the interval."
How are you setting the starting and ending points? I don't see anything in your code to do this other than the basic parameter initialization.
Have you tried physically clicking on the chart?
@firemyst
firemyst
05 Mar 2020, 02:44
( Updated at: 21 Dec 2023, 09:21 )
@Panagiotis / @A.R.,
I think where the issue is here is the functionality differences between the "client" and the "bot".
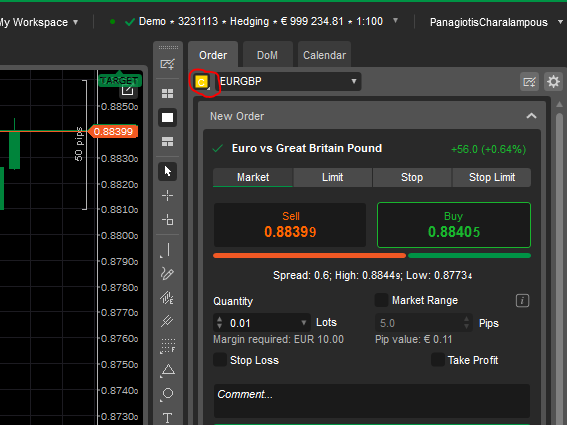
For example, when placing a trade in the client, with a stoploss smaller than the current spread, we receive the following error notification:
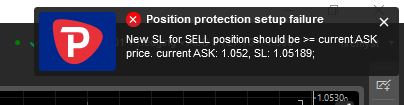
The order is still placed and position still opened - it's just there's no SL set.
When doing something similar in a cBot, what @A.R. is saying is that they would expect some sort of similar notification/exception stating there's a known issue.
However, as @Panagiotis says, you have to ensure yourself by checking the SL after opening the position.
@A.R., a trader's argument might be is the trader might still want the position opened because they got in at a great price. In the client, if this happened, the trader would just modify the order to input a correct SL without closing and reopening the position (to avoid commission costs for example). Also, who's to determine what "a little over the spread" is? Suppose I wanted the SL at 1, but accidentally put in 0.1, and the spread is 0.25? Are you going to make my SL 0.3 now when I really wanted 1?
So your suggestions #2 & #3 above just aren't practical or feasible.
For your suggestion #1 @A.R., what's the difference between checking if the SL is null vs checking to see if an exception is thrown? You still have to perform a check and do something either way.
However, in the .Net framework, checking if the SL is null is significantly faster in terms of performance than using any sort of try/catch block. And with trading, speed is of the essence
.
@firemyst
firemyst
24 Feb 2020, 15:09
( Updated at: 21 Dec 2023, 09:21 )
RE:
PanagiotisCharalampous said:
Hi firemyst,
My code demonstrates how to display On Balance Volume using custom moving averages. Isn't there were your problem was? I cannot reproduce your problem.
Best Regards,
Panagiotis
HI @Panagiotis:
My problem appears to be I wasn't paying attention to the scale on the right of the chart, which is why the lines weren't matching up exactly.

DUH! I hate it when that happens.
Thank you for your assistance and patience as always. :-)
@firemyst
firemyst
24 Feb 2020, 10:27
RE:
PanagiotisCharalampous said:
Hi firemyst,
I am not sure what are you trying to do with your source code but I tried the below and seems ok
using System;
using cAlgo.API;
using cAlgo.API.Internals;
using cAlgo.API.Indicators;
using cAlgo.Indicators;

namespace cAlgo
{
    [Indicator("OBV x MA Crossover", IsOverlay = false, TimeZone = TimeZones.UTC, AccessRights = AccessRights.None)]
    public class OnBalanceVolumexMACrossover : Indicator
    {
        [Parameter("MA Short Period", Group = "Moving Averages", DefaultValue = 13, MinValue = 1)]
        public int MAXOverShortPeriod { get; set; }
        [Parameter("MA SP Type", Group = "Moving Averages", DefaultValue = MovingAverageType.Exponential)]
        public MovingAverageType MAXOverShortPeriodType { get; set; }
        [Parameter("MA Long Period", Group = "Moving Averages", DefaultValue = 48, MinValue = 2)]
        public int MAXOverLongPeriod { get; set; }
        [Parameter("MA LP Type", Group = "Moving Averages", DefaultValue = MovingAverageType.Exponential)]
        public MovingAverageType MAXOverLongPeriodType { get; set; }

        [Output("MA OBV Short", LineColor = "Green", PlotType = PlotType.Line, LineStyle = LineStyle.Solid, Thickness = 1)]
        public IndicatorDataSeries ResultMaObvShort { get; set; }
        [Output("MA OBV Long", LineColor = "Red", PlotType = PlotType.Line, LineStyle = LineStyle.Solid, Thickness = 1)]
        public IndicatorDataSeries ResultMaObvLong { get; set; }
        [Output("OBV", LineColor = "Cyan", PlotType = PlotType.Line, LineStyle = LineStyle.Solid, Thickness = 2)]
        public IndicatorDataSeries ResultObv { get; set; }

        private OnBalanceVolume _onBalanceVolume;
        private OnBalanceVolume _onBalanceVolumeMaLong;
        private OnBalanceVolume _onBalanceVolumeMaShort;
        private MovingAverage _maLong;
        private MovingAverage _maShort;

        private IndicatorDataSeries _longIDS;
        private IndicatorDataSeries _shortIDS;

        private Bars _marketSeries;

        protected override void Initialize()
        {
            // Initialize and create nested indicators
            _marketSeries = MarketData.GetBars(Bars.TimeFrame, SymbolName);
            _maLong = Indicators.MovingAverage(_marketSeries.ClosePrices, MAXOverLongPeriod, MAXOverLongPeriodType);
            _maShort = Indicators.MovingAverage(_marketSeries.ClosePrices, MAXOverShortPeriod, MAXOverShortPeriodType);

            _onBalanceVolumeMaLong = Indicators.OnBalanceVolume(_maLong.Result);
            _onBalanceVolumeMaShort = Indicators.OnBalanceVolume(_maShort.Result);

        }

        public override void Calculate(int index)
        {
            ResultMaObvLong[index] = _onBalanceVolumeMaLong.Result[index];
            ResultMaObvShort[index] = _onBalanceVolumeMaShort.Result[index];
        }
    }
}
Best Regards,
Panagiotis
HI @Panagiotis:
I was trying to graph the OnBalanceVolume in the same indicator area with 1 or two moving averages, with:
1) one line showing the OnBalanceVolume with closing prices
2) the other two lines showing the OnBalanceVolume with the source as the selected MA types and periods from the input parameters. In this case, one OBV with a source of 13 EMA and the second OBV using a source of 48 EMA. I want to be able to set these programmatically without having to use a source parameter, because using a source parameter requires the actual MA to be placed on the chart as far as I can tell.
Your modified code doesn't do that.
Thank you.
@firemyst
firemyst
24 Feb 2020, 10:12
RE:
PanagiotisCharalampous said:
Hi firemyst,
Here it is.
Best Regards,
Panagiotis
Thanks @Panagiotis!
For anyone looking for a code sample, this will return the time as specified on the chart regardless of local user's computer's timezone:
DateTime.UtcNow + Application.UserTimeOffset
@firemyst
firemyst
24 Feb 2020, 06:36
I don't believe these code samples are correct.
For example, with the Engulfing candle, the body of the second candle must engulf the entire body of the first.
However, according to the code, it's just checking that the length of the first body is less than the length of the second candle's body.
Here's an example where the code will return "true" for an engulfing candle, but it technically isn't since the body of the bigger candle doesn't engulf the first.
Treat the plus (+) signs as the body, and the pipes (|) as the wicks.
Yes, the second candle's body is longer than the first, but body doesn't engulf the first:
1st 2nd
|
| +
| +
| +
+ |
| |
|
So, to correct the code above, I believe the above code samples need to check that the opening and closing prices of the first candle also fall within the opening/closing prices of the second candle.
Similarly with the Inide Candle -- the body of the second candle must fall within the open/close of the first candle, not just be smaller.
Unless someone else has a different understanding?
@firemyst
firemyst
23 Feb 2020, 15:31
RE:
PanagiotisCharalampous said:
Hi Tengu,
See an example below
using System;
using cAlgo.API;
using cAlgo.API.Internals;
using cAlgo.API.Indicators;
using cAlgo.Indicators;

namespace cAlgo
{
    [Cloud("Fast MA", "Slow MA", FirstColor = "Aqua", Opacity = 0.5, SecondColor = "Red")]
    [Indicator(IsOverlay = true, TimeZone = TimeZones.UTC, AccessRights = AccessRights.None)]
    public class CloudExample : Indicator
    {
        [Parameter("Fast MA Period", DefaultValue = 21)]
        public int FastMaPeriod { get; set; }

        [Parameter("Slow MA Period", DefaultValue = 50)]
        public int SlowMaPeriod { get; set; }

        [Output("Fast MA", LineColor = "#FF6666")]
        public IndicatorDataSeries FastMaResult { get; set; }

        [Output("Slow MA", LineColor = "#0071C1")]
        public IndicatorDataSeries SlowMaResult { get; set; }

        SimpleMovingAverage FastMa;
        SimpleMovingAverage SlowMa;


        protected override void Initialize()
        {
            FastMa = Indicators.SimpleMovingAverage(Bars.ClosePrices, FastMaPeriod);
            SlowMa = Indicators.SimpleMovingAverage(Bars.ClosePrices, SlowMaPeriod);
        }

        public override void Calculate(int index)
        {
            FastMaResult[index] = FastMa.Result[index];
            SlowMaResult[index] = SlowMa.Result[index];
        }
    }
}
Best Regards,
Panagiotis
HI @Panagiotis:
A few questions from this:
1) how do we draw clouds between multiple lines within an indicator? For example, imagine an indicator on a price chart that draws horizontal lines at 1, 2, 3, and 4. All 4 lines are different colors. I want one cloud drawn between lines 1 & 2; another cloud drawn between lines 2 & 3; a third cloud drawn between lines 3 & 4. Is this possible?
2) If the above is possible, how can we programmatically change the colors of the clouds or give users the ability to select the colors they want the clouds to be?
Thank you.
@firemyst
firemyst
17 Feb 2020, 08:45
RE:
traderfxmaster007 said:
hi everyone, i need your help to update this code to work in version 3.7 thanks.
        [Output("Weak Up Trend", Color = Colors.Green, PlotType = PlotType.Histogram, Thickness = 2)]
        public IndicatorDataSeries weakbuy{ get; set; }
[Output("Weak Up Trend", LineColor = "Green", PlotType = PlotType.Histogram, LineStyle = LineStyle.Solid, Thickness = 2)]
public IndicatorDataSeries weakbuy { get; set; }
@firemyst
firemyst
17 Feb 2020, 08:40
RE:
Shares4UsDevelopment said:
Hi Community,
Is there a better way to get multisymbol tick data(ask/bid/name/time) than the way i'm doing it now (see program below)?
and @CTDN Why isn't time in the tick info?using System; using System.Linq; using cAlgo.API; using cAlgo.API.Indicators; using cAlgo.API.Internals; using cAlgo.Indicators; namespace cAlgo.Robots { [Robot(TimeZone = TimeZones.UTC, AccessRights = AccessRights.None)] public class TickEventCheck : Robot { Symbol NOKJPY, AUDCAD; Ticks tNOKJPY, tAUDCAD; protected override void OnStart() { NOKJPY = Symbols.GetSymbol("NOKJPY"); NOKJPY.Tick += SymbolTick; tNOKJPY = MarketData.GetTicks("NOKJPY"); AUDCAD = Symbols.GetSymbol("AUDCAD"); AUDCAD.Tick += SymbolTick; tAUDCAD = MarketData.GetTicks("AUDCAD"); } protected override void OnTick() { Print("OT:" + Symbol.Name, " ", Symbol.Ask, " ", Symbol.Bid); } private void SymbolTick(SymbolTickEventArgs symbolTick) { DateTime TickTime = (symbolTick.SymbolName == "AUDCAD" ? tAUDCAD : tNOKJPY).LastTick.Time; Print("ST:" + symbolTick.SymbolName, " ", symbolTick.Ask, " ", symbolTick.Bid, " ", TickTime); } } }
Best rgds,
Yes, there's a much better, and cleaner way. Create a Dictionary object with your symbols as the key and the function as the value.
Something like (this code isn't exact as I'm doing this off the cuff) :
Dictionary<string, Action<>> tickFunctions = new Dictionary<string, Action<>>();

tickFunctions.Add("AUDCAD", tAUDCAD.LastTick.Time);
tickFunctions.Add("NOKJPY", tNOKJPY.LastTick.Time);
And then your SymbolTick function turns into something like:
private void SymbolTick(SymbolTickEventArgs symbolTick)
	{
		DateTime TickTime = DateTime.Min;
		if (tickFunctions.Contains(symbolTick.SymbolName))
		{
			TickTime = tickFunctions[symbolTick.SymbolName];
			Print("ST:" + symbolTick.SymbolName, " ", symbolTick.Ask, " ", symbolTick.Bid, " ", TickTime);
		}
		else
			Print("Hello there.");
	}
@firemyst
firemyst
14 Feb 2020, 18:40
You can start with this:
https://ctrader.com/forum/cbot-support/10910
@firemyst
firemyst
14 Feb 2020, 18:38
RE:
jjwes76@gmail.com said:
MACD Histogram need help please
hi to all
How do i use the histogram LAST value (signal line value) to place a Limit Order
Example the fast ma crosses above the slow ma and the signal line of the histogram shows 70
the cbot must place a limit order 70 pips above the crossing
please use the MA crossing as a example
I am stuck please help
You should look at this thread:
https://ctrader.com/forum/cbot-support/9816
and this:
https://ctrader.com/algos/cbots/show/155
@firemyst
firemyst
14 Feb 2020, 18:19
Add them to a Dictionary<string,double> object (assuming the results are doubles), sort the dictionary, and then loop over it.
Examples:
using System;
using System.Collections.Generic;
using System.Linq;

class Program
{
    static void Main()
    {
        // Example dictionary.
        var dictionary = new Dictionary<string, int>(5);
        dictionary.Add("cat", 1);
        dictionary.Add("dog", 0);
        dictionary.Add("mouse", 5);
        dictionary.Add("eel", 3);
        dictionary.Add("programmer", 2);

        // Order by values.
        // ... Use LINQ to specify sorting by value.
        var items = from pair in dictionary
                    orderby pair.Value ascending
                    select pair;

        // Display results.
        foreach (KeyValuePair<string, int> pair in items)
        {
            Console.WriteLine("{0}: {1}", pair.Key, pair.Value);
        }

        // Reverse sort.
        // ... Can be looped over in the same way as above.
        items = from pair in dictionary
                orderby pair.Value descending
                select pair;
    }
}
@firemyst
firemyst
14 Feb 2020, 02:03
RE:
PanagiotisCharalampous said:
Hi firemyst,
Why do you think this is an issue?
Best Regards,
Panagiotis
HI @Panagiotis:
I raised it because in the last 4-5 versions of cTrader, with the thousands of trades placed, there is not one other entry in my entire history where the pips are displayed out to more than 3 decimal places.
So to suddenly see two entries in a row, and only with the latest cTrader version, rounded out to 10 decimal places, raised a flag on functionality I thought worth clarifying it's working as expected.
@firemyst
firemyst
10 Feb 2020, 10:14
RE:
PanagiotisCharalampous said:
Hi firemyst.
The cloud option works only between two IndicatorDataSeries. In your case just add another continuous transparent IndicatorDataSeries that will have all the values and use it for your cloud.
Best Regards,
Panagiotis
Awesome.
How do I set a default color being "transparent" with the line color attribute?
For example, using:
LineColor = "Green"
Is there a special hex code or something to do it?
Thanks @Panagiotis!
@firemyst
firemyst
21 Mar 2020, 15:04
You haven't said if "IsOverlay=false" or not
You haven't shown us with your code if this indicator is "IsOverlay" or not.
In a test indicator I have where "IsOverlay = false", the following both work as expected:
@firemyst