Topics
Replies
firemyst
08 May 2019, 10:40
( Updated at: 21 Dec 2023, 09:21 )
RE:
Panagiotis Charalampous said:
Hi FireMyst,
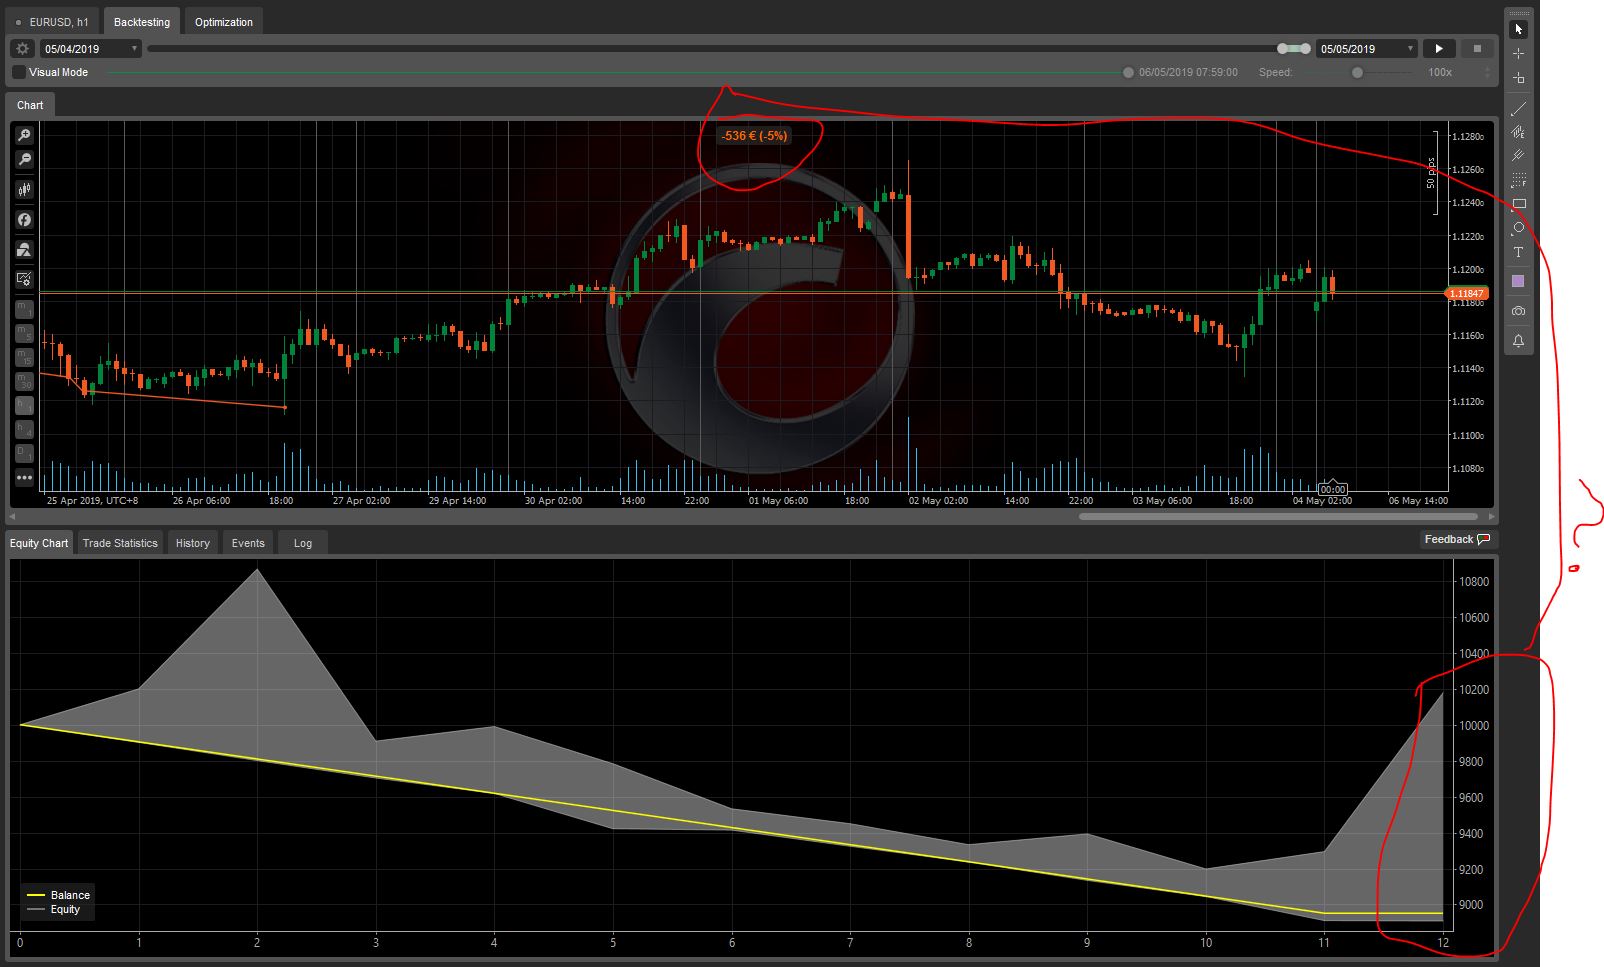
I had a look at the cBot. Please note that the chart does not show the equity at the moment that the backtesting finishes but the max equity reached since the moment the last position was closed (in this case 07/03). In other words, it says that since the 07/03 till the 20/04, the max equity reached 10400. The balance shows correclty and the ending equity is calculated based on the unrealized P&L of the remaining open positions.
Let me know if this clarifies things.
Best Regards,
Panagiotis
Hi @Panagiotis:
Unfortunately, your explanation doesn't make sense to me. What chart are you referring to since multiple ones are posted? In neither posting #5 or #7 do I see any place where either the graphing is around 10,400; in post#5 with the chart, the highest equity is $10,530 when position 1 is closed, and position 2 is still open. In Posting #1, there is no place where the equity is "-7".
To avoid confusion, let's stick with the code I have posted.
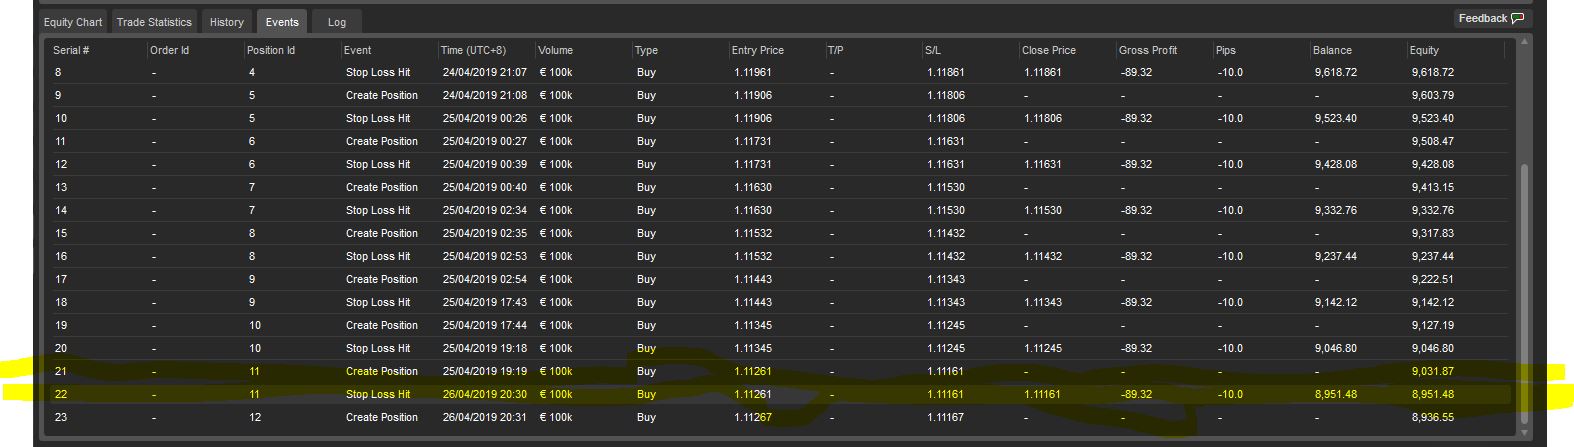
Here are the screen captures from running it with highlights on the screen. The TOP of the bar chart says,"-536". The "last position closed" according to the "events" tab, is 11 (3rd capture). The "equity" at that point, according to the events tab, is 9031 - 8951 -- neither of which is 536 below the starting balance of 10,000, correct?
So according to these charts, where does the -536 come from or how is it calculated from the results shown exactly?
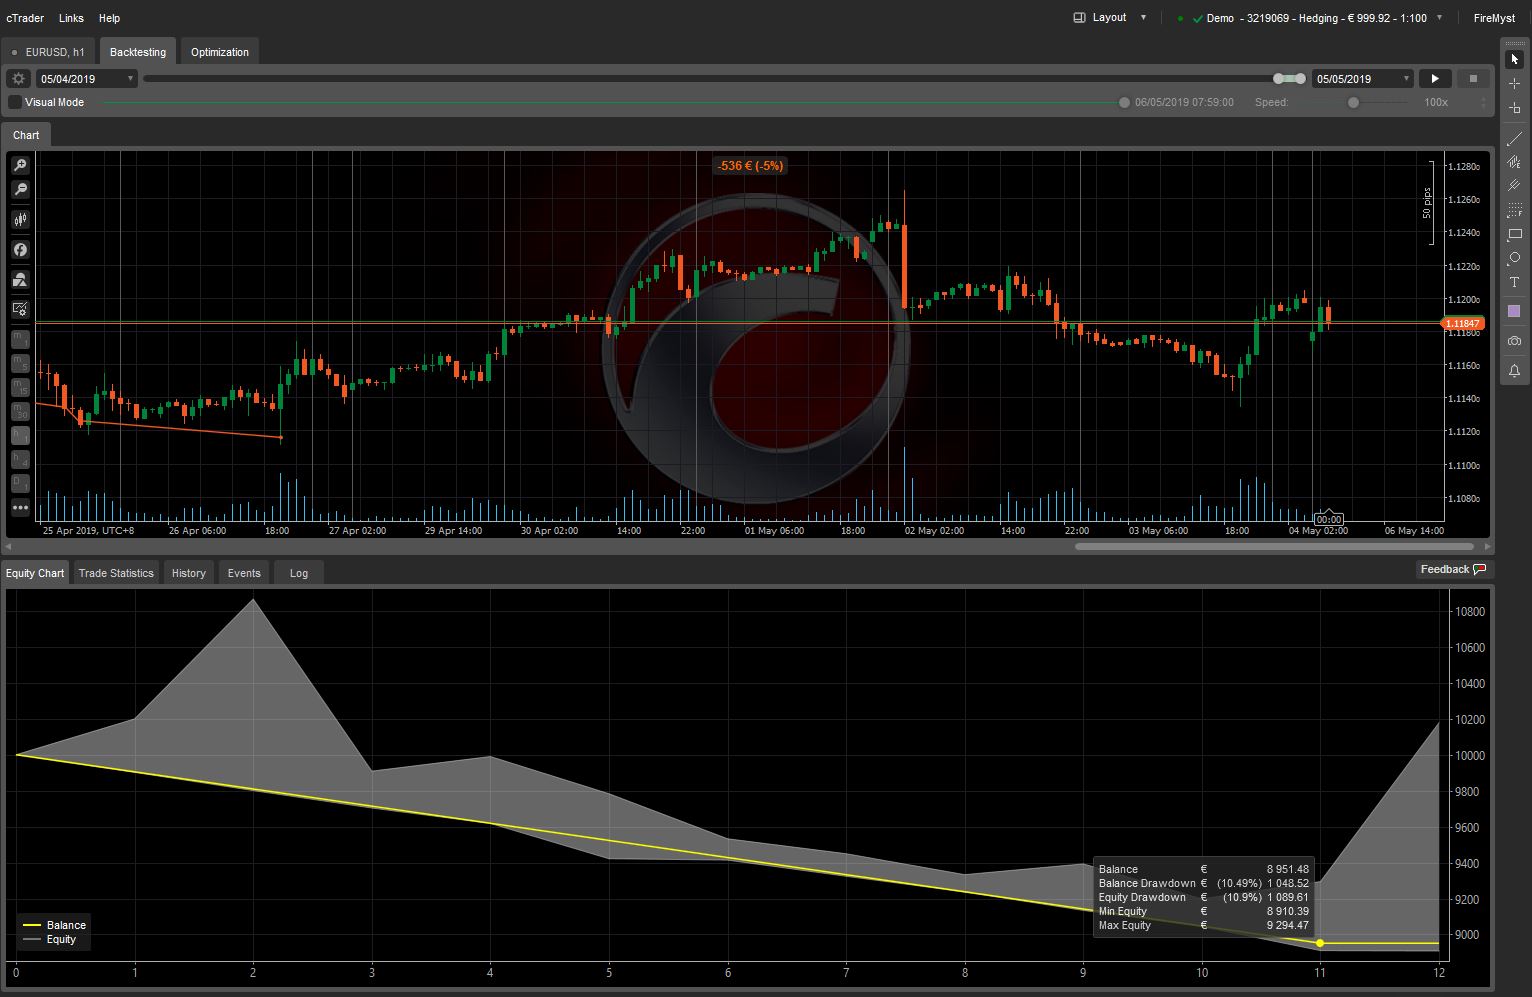
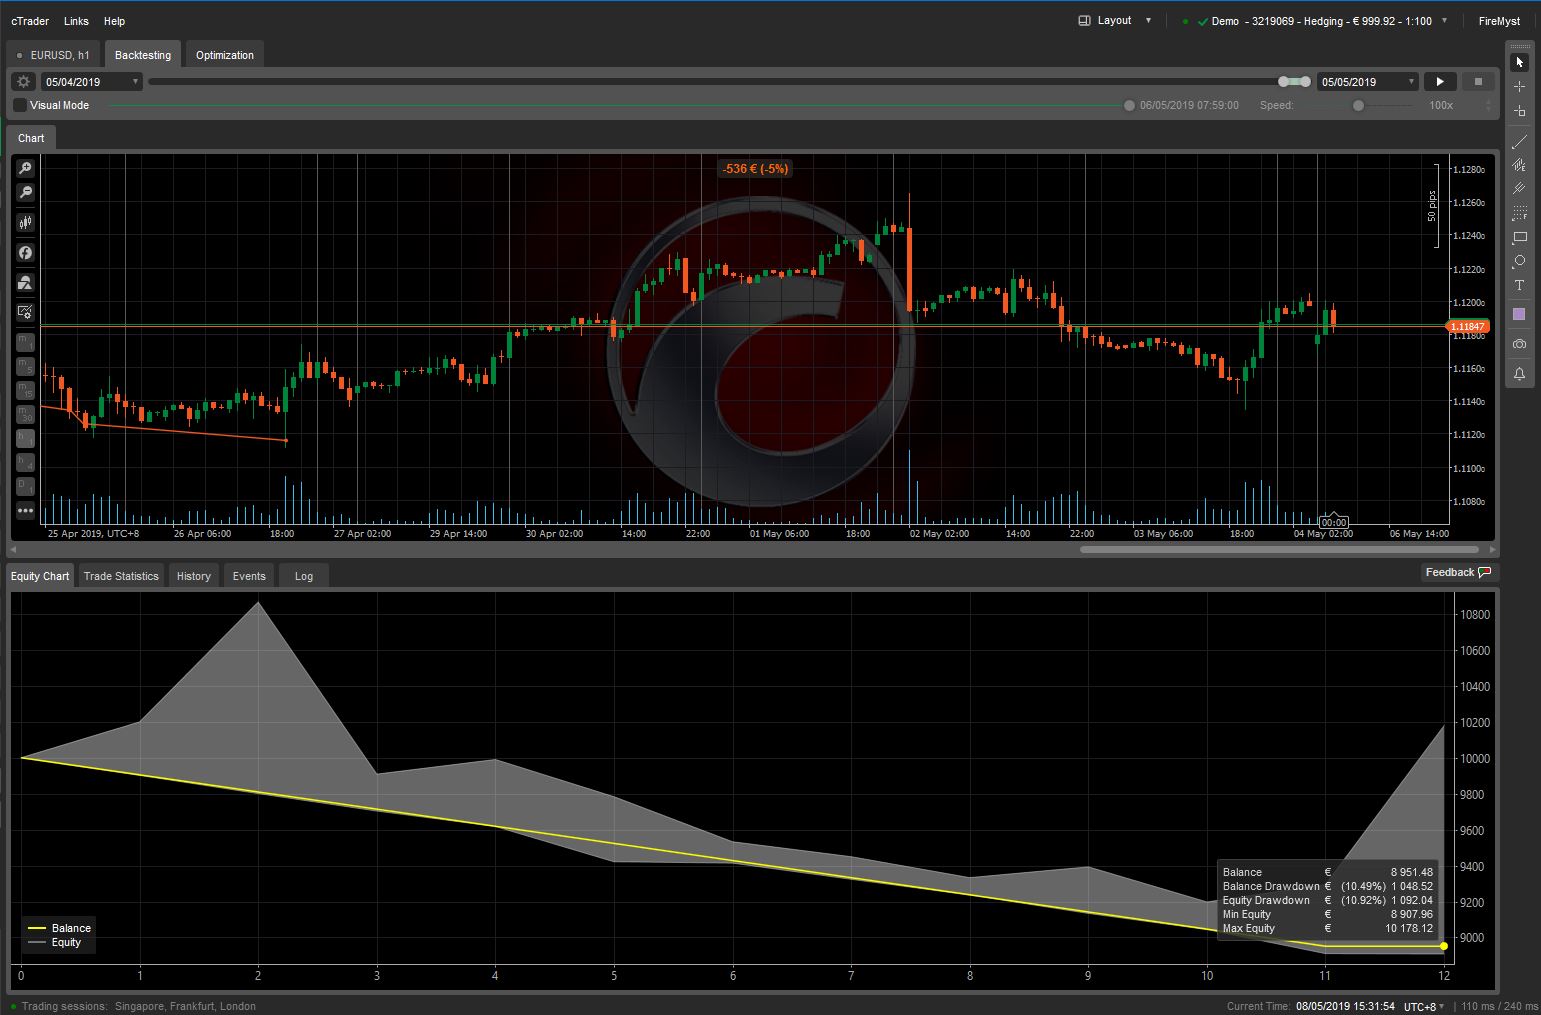
In the above two highlighted lines, both the "balance" and the equity is way lower than the -536 displayed on the top of the bar graph.
Thank you :-)
@firemyst
firemyst
07 May 2019, 09:05
RE:
Jiri said:
Hi Spotware,
When you try to access other types of properties than IndicatorDataSeries the object is not accessible due to lazy loading unless you try to access together with an IndicatorDataSeries. Please see sample below.
I experienced similar issues.
Apparently this is intended behavior.
See this thread:
https://ctrader.com/forum/ctrader-support/16386
@firemyst
firemyst
07 May 2019, 06:16
Update on this for everyone:
After further investigations with Team Spotware and @Panagiotis , it appears that the root cause of this issue is the "lazy loading" with indicators.
In the above code, there's the following:
if (_zlema.IsInUpTrend) { ... }
However, those property values haven't been loaded yet (the "lazy loading").
So above those statements where a _zlema property is first checked, the following code (or similar) needs to be:
var a = _zlema.Result.Last(0);
This ensures all the current property values for the indicator are loaded.
After doing this, the results are the same regardless of which print statement is used.
Thank you.
@firemyst
firemyst
06 May 2019, 16:47
RE:
Panagiotis Charalampous said:
Hi FireMyst,
1) references all the other indicators I want used in the calculations
2) incorporate the bot's calculation logic
indeed this is the correct approach
There's currently no way then to draw objects on a chart that's not the main chart? Or is there?
There is but you need to manually add the area. See below an example
Chart.IndicatorAreas[0].DrawText("Test", "Test", Server.Time, 50, Color.Red);Best Regards,
Panagiotis
Perfect! Thanks yet again!
@firemyst
firemyst
06 May 2019, 16:32
RE:
Panagiotis Charalampous said:
Hi FireMyst,
I am not sure what do you expect to happen here. Indicators referenced by cBots are not displayed on the charts.
Best Regards,
Panagiotis
What I was hoping to achieve, is to have some values calculated in the bot based on all the indicators on the current tick, and then display those calculated values on a separate chart (hence the "IsOverlay = false" because those calculated values would be anywhere from -10...0...10 (kind of like an oscillator).
But from what you're telling me, I'd have to create another indicator that:
1) references all the other indicators I want used in the calculations
2) incorporate the bot's calculation logic
and add it to the chart as a separate indicator?
There's currently no way then to draw objects on a chart that's not the main chart? Or is there?
Thank you.
@firemyst
firemyst
06 May 2019, 16:08
RE:
Panagiotis Charalampous said:
Hi FireMyst,
The levels will appear when your indicator starts getting more values. At the moment it is zoomed at 0. e.g.
using System;
using cAlgo.API;
using cAlgo.API.Internals;
using cAlgo.API.Indicators;
using cAlgo.Indicators;
using System.Collections.Generic;

namespace cAlgo
{
    [Levels(2, 1, 0)]
    [Indicator(IsOverlay = false, TimeZone = TimeZones.UTC, AccessRights = AccessRights.None)]
    public class ConditionsOfEntry : Indicator
    {
        [Output("UpwardSell", LineStyle = LineStyle.Solid, PlotType = PlotType.Points, LineColor = "Red")]
        public IndicatorDataSeries UpwardSell { get; set; }
        [Output("UpwardNeutral", LineStyle = LineStyle.Solid, PlotType = PlotType.Points, LineColor = "Yellow")]
        public IndicatorDataSeries UpwardNeutral { get; set; }
        [Output("UpwardBuy", LineStyle = LineStyle.Solid, PlotType = PlotType.Points, LineColor = "Lime")]
        public IndicatorDataSeries UpwardBuy { get; set; }

        public int UpwardCount { get; set; }

        private const int UpwardMax = 5;

        public override void Calculate(int index)
        {
            //if (UpwardCount >= UpwardMax)
            UpwardBuy[index] = index % 10;
            //else if (UpwardCount > Math.Round(UpwardMax / 2.0, MidpointRounding.AwayFromZero))
            //    UpwardNeutral[index] = UpwardCount;
            //else
            //    UpwardSell[index] = UpwardCount;
        }

    }
}
Best Regards,
Panagiotis
I obviously found that a bit confusing because when I specify levels, I'd expect to see them there when the chart loads.
Might be worth considering updating the API documentation so others aren't caught out by it,but I'll leave that decision with your team.
Thank you.
@firemyst
firemyst
06 May 2019, 16:02
RE:
Panagiotis Charalampous said:
Hi FireMyst,
1) We will fix the description.
2) It seems you are using new features included in 3.5 but compiling with 3.3. To solve this issue, close Spotware cTrader 3.5, go to C:\Users\UserName\Documents\cAlgo\API, delete all files in the folder and restart cTrader 3.5.
3) Deprecated fileds are not shown in Intellisence. If you want to use v3.3 of the API, repeat the process described in point 2 but with a 3.3 instance of cTrader.
Best Regards,
Panagiotis
Awesome. That fixed issues 2 & 3. Thank you.
Whatever they're paying you, it's not enough. ;-)
@firemyst
firemyst
06 May 2019, 12:41
RE:
Panagiotis Charalampous said:
Hi FireMyst,
What do you expect the code to do? UpwardCount is always 0.
Best Regards,
Panagiotis
I expect cTrader to show the levels 0, 1, 2 as per the Levels specification at the top of the code:
[Levels(2, 1, 0)]
regardless of what the output values would be.
Just like some indicators would have levels -2, -1, 0, 1, 2, but if the indicator runs and never goes below zero, the levels -1 and -2 are still shown.
@firemyst
firemyst
06 May 2019, 12:34
( Updated at: 19 Mar 2025, 08:57 )
RE: RE:
FireMyst said:
Panagiotis Charalampous said:
Hi FireMyst,
Send it at support@ctrader.com.
Best Regards,
Panagiotis
Sent. Let me know if you don't receive it.
NOTE! : the attached CS file as some characters in UNICODE format, so if you open the text file in something other than Visual Studio or Notepad++, they may be lost, and they may be part of what's causing the issue.
Description with how to reproduce the issue is embedded within the code with comments.
Thank you.
PS: the Algo file was sent in a separate email as a "zip" attachment. SO you should receive 2 messages from me :-)
@firemyst
firemyst
06 May 2019, 12:20
( Updated at: 19 Mar 2025, 08:57 )
RE:
Panagiotis Charalampous said:
Hi FireMyst,
Send it at support@ctrader.com.
Best Regards,
Panagiotis
Sent. Let me know if you don't receive it.
NOTE! : the attached CS file as some characters in UNICODE format, so if you open the text file in something other than Visual Studio or Notepad++, they may be lost, and they may be part of what's causing the issue.
Description with how to reproduce the issue is embedded within the code with comments.
Thank you.
@firemyst
firemyst
06 May 2019, 12:11
( Updated at: 21 Dec 2023, 09:21 )
RE:
Panagiotis Charalampous said:
Hi FireMyst,
Probably this is what is happening but I cannot confirm if I do not execute this myself :)
Best Regards,
Panagiotis
Here you go. Still doing it in cTrader 3.5 Beta. It says "-536" at the top, but at the bottom the "balance" is below 9000 and the equity is all over the place:
Here is the code so you can run it yourself:
using System;
using System.Linq;
using cAlgo.API;
using cAlgo.API.Indicators;
using cAlgo.API.Internals;
using cAlgo.Indicators;

namespace cAlgo.Robots
{
    [Robot(TimeZone = TimeZones.UTC, AccessRights = AccessRights.None)]
    public class TestBot : Robot
    {
        private string _positionLabel = String.Empty;
        private MarketSeries _marketSeries;

        protected override void OnStart()
        {
            _marketSeries = MarketData.GetSeries(Symbol, MarketSeries.TimeFrame);
            DataSeries series = _marketSeries.Close;
            _positionLabel = (MarketSeries.TimeFrame) + " " + Symbol.Code + " Test Bot";
        }

        protected override void OnTick()
        {
            if (SumOfLongEntryConditions() >= 5)
                Print("Hello");
            else
                Print("Oh no!");
            if (Positions.Count < 1)
                ExecuteMarketOrder(TradeType.Buy, Symbol, 100000, "test", 10, null);

        }

        private int SumOfLongEntryConditions()
        {
            int _sumOfLongEntryConditions = 4;
            return _sumOfLongEntryConditions;
        }
    }
}
I'll be eagerly awaiting :-)
@firemyst
firemyst
06 May 2019, 12:05
( Updated at: 21 Dec 2023, 09:21 )
Error in Intellisense and perhaps a bug?
HI SpotWare:
1) See the red-lines in screen capture. How come the property says "{ get; }", yet the description says "Get or sets"? It can't set if there's no "set" implementation.
2) See the compile error. I have this code under a Bot instance of "EURUSD", so how come SymbolName isn't valid in the current context if that's what we're supposed to use?
See screen capture: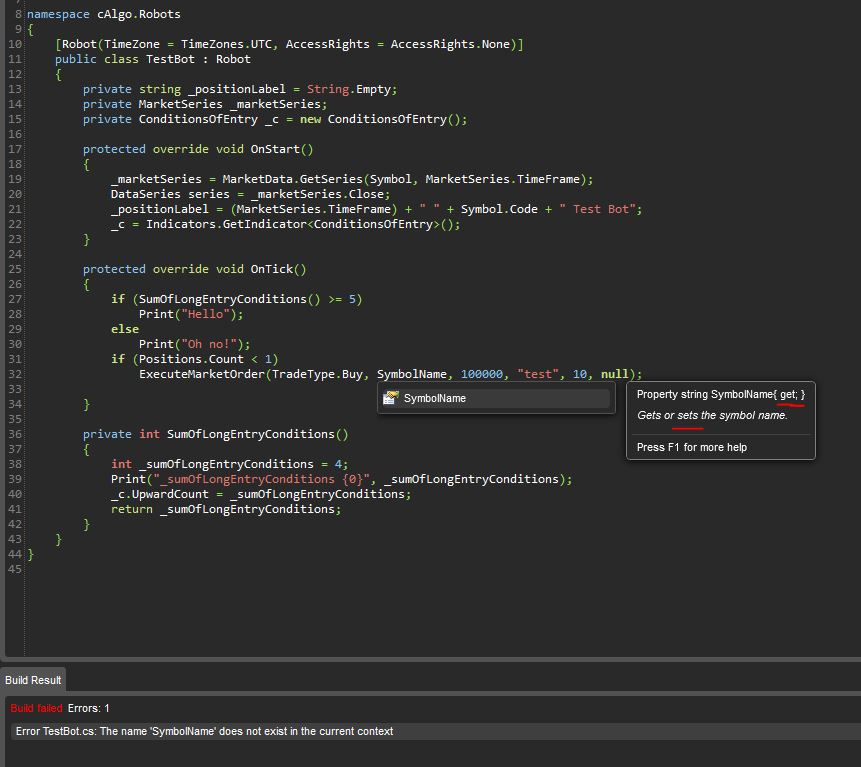
3) If I replace "SymbolName" with "Symbol" on line 32, the compiler doesn't spit out an error message about using "Symbol.Code" on line 21 even though it's not there according to Intellisense. If it's 'deprecated', the compiler should at least say so:
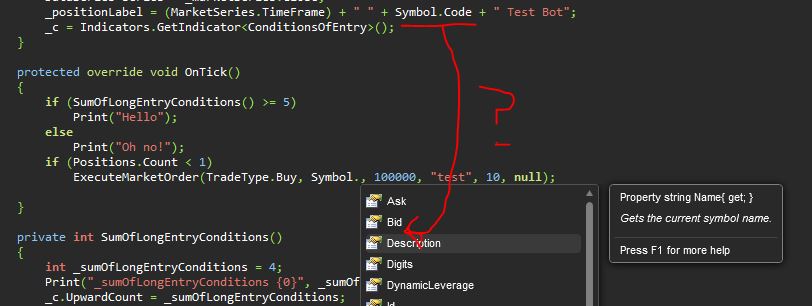
Thank you.
@firemyst
firemyst
02 May 2019, 06:37
RE:
DonaldD said:
Hi guys,
I am planning to develop some more indicators for cTrader (both paid and free) and I was wondering which indicators do you think are missing and would be worth adding to cTrader ecosystem? Suggestions as well as documentation about the indicators would be highly appreciated!
Donald
* John Ehlers Hilbert Sine Wave and Oscillator or at leasts something similar to https://emini-watch.com/trading-indicators/hilbert-sine-wave/
@firemyst
firemyst
02 May 2019, 05:32
RE:
tgjobscv said:
F**king error:
cTrader.exe - aplikation error - the exception unknown software exception (0xe0434352) occurred in the application at location at location 0x753f1cda.
What now ?
How fix ?
Regards.
Have you tried debugging your code, and running it line-by-line in Visual Studio to see exactly where it occurs in your code? Or at least rule out that it's not your code specifically causing the error?
@firemyst
firemyst
02 May 2019, 05:31
As a side note, you might get some responses if you add a bit more details to the requirements you're wanting.
For example:
1) do you want this "shift" to be parameterized so it can be easily configured/adjusted without having to recompile code each time?
2) what exactly do you mean by "Shift"? What you think you are referring to might be different than what the reader understands.
etc etc.
@firemyst
firemyst
08 May 2019, 11:26
RE:
Panagiotis Charalampous said:
OK, That makes a bit more sense now. I was reading those numbers at the top of the chart as the total overall gain/loss for the entire test period, which it can't obviously provide if there's still open positions when the bot comes to the end of the test period and positions are still open.
Thank you.
So am I correct to say then that if I have bots with parameters, and I want to see what parameter settings will give me the highest 'balance' at the end when the bot stops, I have to look at the "balance" line on the equity chart and compare the differences in runs between those different parameter settings?
For instance, if I started overall with 10,000 in my account, my current balance could be at 20,000 with a lot of good wins, the current trade is -536, meaning I have 19,400 (roughly) in equity, but overall at least a 9,400 gain since starting at 10,000 if I were to close everything out and take unrealized P&L.
Thus the "balance" line on the equity chart would be hovering around the 20,000 mark, with the 'equity' gray around coloured down to around the 19,400 area.
Is that about right?
@firemyst