Topics
Replies
firemyst
25 Feb 2025, 00:04
You're falling into a trap a lot of people do when trying to load back tick data for Renko charts.
The trap is you're doing everything in the initialize method, instead of setting up your code to load asynchronously. The issue is, depending on how far back you load the data from, there could be an absolutely boat-load of data to download. For instance, if you do more than a week on the indices such as the DOW, DAX, or NAS, there's going to be hundreds of thousands of ticks.
And to compound the issue, if the server connection isn't the fastest, or you have slow internet, or something else, it will take a loooooooooooong time to download, hence the process being automatically terminated by cTrader for not responding.
So you need to start loading the back-tick data asynchronously and keep that going until all the tick data you want is loaded asychronously. Set a flag to indicate when it's done.
In the meantime, in the calculate method (on each incoming tick), check that the back data is fully loaded (eg, your flag) before you do anything else.
In regards to your commented code, I tried to make heads/tails out of it. In a nutshell, doing it asynchronously, you want to do something like this:
yourStructureForStoringTickdata.OpenTimes.Reverse().LastOrDefault() > _fromDateTime
{
yourStrutureForStoringTickData.LoadMoreHistoryAsync( … )
}
@firemyst
firemyst
24 Feb 2025, 01:58
That's the way the MACD works. the Zero-line is the longer MA of the two MA's the MACD is monitoring. When it crosses the zero line, it means it's the faster ma is crossing the slower ma either up or down.
Two options:
- put the two MA's on your chart and watch them when they cross instead of using the MACD on the chart
- edit your code to add a predefined amount to all MACD values so it's displayed over the candles. So in the chart in your example, add 1.048 to all the values. The problem with this approach though is it'll have to be updated frequently as the chart changes (eg, it could be 1.052 tomorrow or 1.02 the day after, so probably best ot make it a parameter)
@firemyst
firemyst
23 Feb 2025, 08:49
There is an indicator in the MT4 trading platform called i-exposure.
What is this i-exposure indicator known as on all other platforms?
It might not be known as anything because it might just be custom developed by someone for MT4.
If you learn how to use Google, you would see that Spotware has already provided you the code and step by step instructions on how to create your pivot points indicator:
https:// help . ctrader . com /ctrader-algo/articles/for-developers/how-to-create-pivot-point-and-fractal-indicators/#create-a-pivot-point-indicator
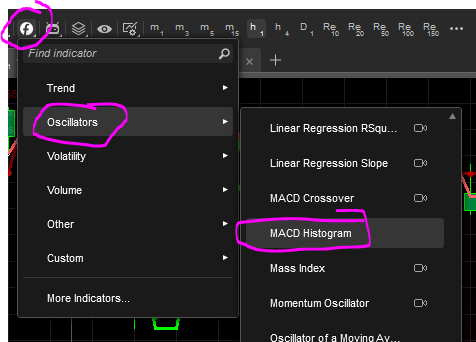
I have no idea why you're asking for the MACD Histogram indicator because it's already provided for in cTrader.
@firemyst
firemyst
23 Feb 2025, 08:38
I don't think you can individually. The broker can only change settings according to what Spotware allows, as all servers are connected to real price feeds via FIX API.
So you'd have to contact them, and see if you can change the feed via FIX if you're doing things programmatically. If you just want to change the feed of something like cTrader desktop, good luck. You'd have to contact your broker and I doubt they'll do it for one person considering they'd have to go through Spotware to do so.
@firemyst
firemyst
23 Feb 2025, 08:17
I myself don't understand what you're asking, and I suspect nobody else does either since you haven't had a response.
I don't know of a “C TREYDER”, but there's “cTrader”. cTrader is a platform, which can be downloaded from any broker that offers it as a platform for you to try.
I understand that funding firms provide demo accounts, but these are operated through other platforms and not directly via C TREYDER.
This doesn't make sense. cTrader is a trading platform just like MT4/MT5; anyone who gives you an account where you can use cTrader is a broker. A broker is not a platform.
@firemyst
firemyst
25 Feb 2025, 04:08
Duplicate to /forum/suggestions/46357/
@firemyst