Topics
Replies
PanagiotisCharalampous
16 Mar 2021, 08:34
Hi selesradovan,
The supported export format is .xls and the supported application is Excel. Can you reproduce this problem using Excel?
Best Regards,
Panagiotis
@PanagiotisCharalampous
PanagiotisCharalampous
16 Mar 2021, 08:32
Hi r.stipriaan,
Are you aware that the Polynomial Regression Channels is a redrawing indicator and its values change over time?
Best Regards,
Panagiotis
@PanagiotisCharalampous
PanagiotisCharalampous
16 Mar 2021, 08:28
( Updated at: 16 Mar 2021, 08:29 )
Dear both,
Could you please ask your question in English? This is an English speaking forum and from the translation, the question is not clear. You can also consider asking your question in the Portuguese community.
Best Regards,
Panagiotis
@PanagiotisCharalampous
PanagiotisCharalampous
16 Mar 2021, 08:25
Hi matt92,
Can you please send us some troubleshooting information. To do so, please press Ctrl+Alt+Shift+T to get the troubleshooting form, paste the link to this discussion inside the text box and press submit.
Best Regards,
Panagiotis
@PanagiotisCharalampous
PanagiotisCharalampous
16 Mar 2021, 08:22
Dear all,
You might find this indicator helpful.
Best Regards,
Panagiotis
@PanagiotisCharalampous
PanagiotisCharalampous
16 Mar 2021, 08:19
Hi szkk,
You can use Linked Charts to achieve this.
Best Regards,
Panagiotis
@PanagiotisCharalampous
PanagiotisCharalampous
12 Mar 2021, 14:01
Hi dani20102015,
You can only have one chart during backtesting.
Best Regards,
Panagiotis
@PanagiotisCharalampous
PanagiotisCharalampous
12 Mar 2021, 08:20
( Updated at: 21 Dec 2023, 09:22 )
Hi undertable999,
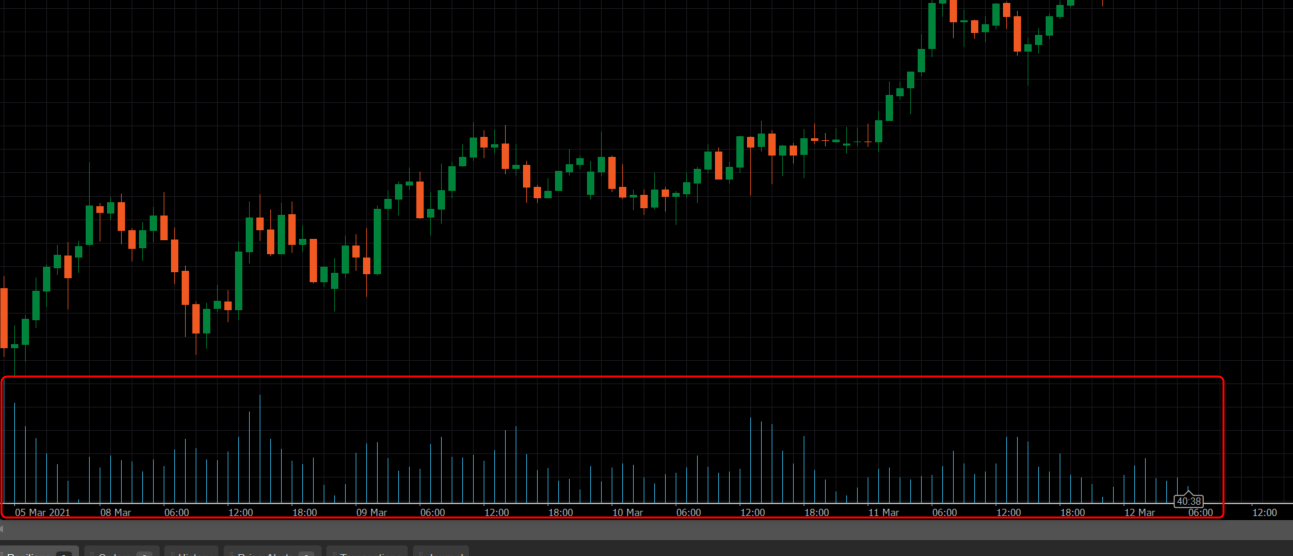
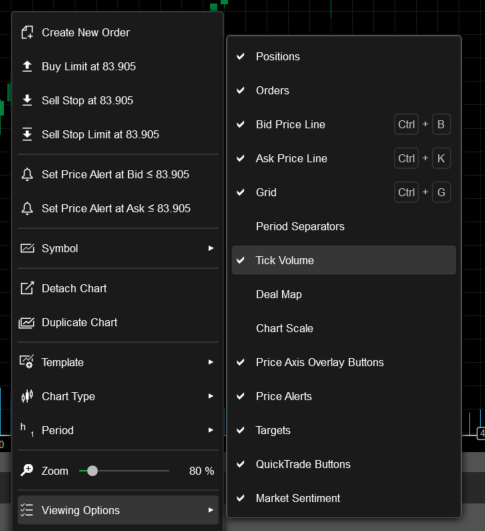
You can see tick volume on the bottom of the chart.

You can enable it in Viewing Options. See below

Best Regards,
Panagiotis
@PanagiotisCharalampous
PanagiotisCharalampous
11 Mar 2021, 16:46
Hi WeissTradingGermany,
After our fruitful discussion on Telegram, I assume that your questions have been answered :)
Best Regards,
Panagiotis
@PanagiotisCharalampous
PanagiotisCharalampous
11 Mar 2021, 16:02
Hi prosteel1,
If this does not happen in Spotware Beta, then it is probably fixed. Wait for both brokers to receive the update and let us know if it still happens.
Best Regards,
Panagiotis
@PanagiotisCharalampous
PanagiotisCharalampous
11 Mar 2021, 15:32
Hi ctid444989,
Thanks, we will fix the link in an update. The correct link is here.
Best Regards,
Panagiotis
@PanagiotisCharalampous
PanagiotisCharalampous
11 Mar 2021, 12:03
Hi maxdelater,
Can you share the complete cBot code?
Best Regards,
Panagiotis
@PanagiotisCharalampous
PanagiotisCharalampous
11 Mar 2021, 11:49
Ηι eliezer_barros,
It seems to be an issue with your SMTP settings. You need to verify that your SMTP settings are correct.
Best Regards,
Panagiotis
@PanagiotisCharalampous
PanagiotisCharalampous
11 Mar 2021, 10:46
Hi ctid444989,
Where did you find this link?
Best Regards,
Panagiotis
@PanagiotisCharalampous
PanagiotisCharalampous
11 Mar 2021, 08:16
Hi ctid318043,
Accounts can be accessed only from the broker's cTrader. Make sure you are using IC Markets cTrader.
Best Regards,
Panagiotis
@PanagiotisCharalampous
PanagiotisCharalampous
11 Mar 2021, 08:14
Hi Cashpoint,
Who is your broker?
Best Regards,
Panagiotis
@PanagiotisCharalampous
PanagiotisCharalampous
10 Mar 2021, 16:10
( Updated at: 10 Mar 2021, 16:33 )
Hi arunsub321,
I have explained to you why this happens. As per the log, you are sending three orders to close the same position at the same time
2021.03.10 14:01:41.349 | Request to close position PID71780050 is sent to server
2021.03.10 14:01:41.349 | Request to close position PID71780050 is sent to server
2021.03.10 14:01:41.349 | Request to close position PID71780050 is sent to server
If you cannot spot the problem in your code, please share the source code and we will try to find the problem for you.
Best Regards,
Panagiotis
@PanagiotisCharalampous
PanagiotisCharalampous
10 Mar 2021, 14:25
Hi Takis,
This is caused due to a lazy loading design of the IndicatorDataSeries. Calculate function is only called when Last() method and LastValue property are called for an output IndicatorDataSeries. This was always the case.
Best Regards,
Panagiotis
@PanagiotisCharalampous
PanagiotisCharalampous
10 Mar 2021, 08:29
Hi bienve.pf,
Here is the complete cBot code. It seems to work fine for me
using System;
using System.Linq;
using cAlgo.API;
using cAlgo.API.Indicators;
using cAlgo.API.Internals;
using cAlgo.Indicators;

namespace cAlgo.Robots
{
    [Robot(TimeZone = TimeZones.UTC, AccessRights = AccessRights.None)]
    public class NewcBot : Robot
    {
        [Parameter("Timeframe")]
        public TimeFrame Timeframe { get; set; }

        protected override void OnStart()
        {
            ChartTrendLine _line = null;

            Chart.MouseMove += arg =>
            {
                if (_line != null)
                {
                    _line = Chart.DrawTrendLine("myline", _line.Time1, _line.Y1, arg.TimeValue, arg.YValue, Color.Yellow, 2);
                    Chart.DrawStaticText("info", "Time1: " + _line.Time2.ToString() + "/ Y1: " + _line.Y2, VerticalAlignment.Top, HorizontalAlignment.Left, Color.Yellow);
                }
            };
            Chart.MouseDown += arg =>
            {
                Print("MouseDown event....");
                if (_line == null)
                {
                    _line = Chart.DrawTrendLine("myline", arg.TimeValue, arg.YValue, arg.TimeValue, arg.YValue, Color.Yellow, 2);
                    _line.IsInteractive = false;
                }
                else
                {
                    _line.IsInteractive = true;
                    _line = null;
                }
            };

        }

        protected override void OnStop()
        {
            // Put your deinitialization logic here
        }
    }
}
Best Regards,
Panagiotis
@PanagiotisCharalampous
PanagiotisCharalampous
16 Mar 2021, 08:39
Hi TopCat,
Please note that based on the Community Rules and Guidelines
The next time you will write a post in this manner, you will be banned from the forum.
If you want us to assist you with your problem, please provide helpful information, like videos, screenshots and exact steps to reproduce the issue.
Best Regards,
Panagiotis
Join us on Telegram
@PanagiotisCharalampous