Topics
Replies
MaVe
01 Feb 2016, 08:54
The problem is:
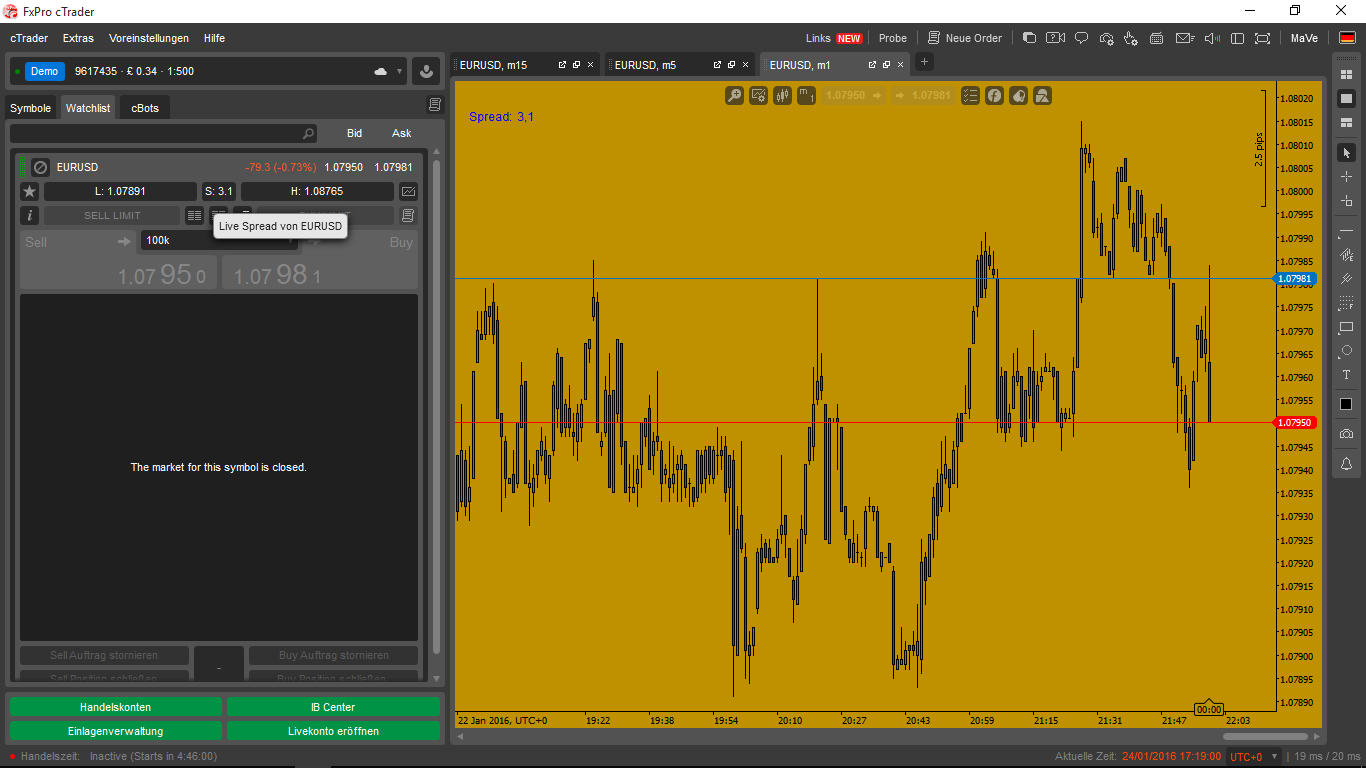
- at the Metals and Currencies, the dailyOpen is missing on Sunday
- at the Energies, the dailyOpen is missing on Monday
So it seems to me that the dailyOpen is skipping the first day of the week.
How do I correct that?
// This indicator displays the daily OHLC.
// The daily High/Low horizontal lines are extended two days into the future. (Colors: red and green.)
// The dailyClose is only on the next day visible (as the previousClose) and extended one extra day into the future. (Color: blue.)
// The dailyOpen for each day is a solid, fat line. (Color: mediumblue.)
//
// The logic of the LineStyle:
//
//               Daily:            solid  line
//               Previous(p):      ---- dashed line
//               prePrevious(pp):  .... dotted line
//
//
// Daily Result:                Occurred at:           Color:
//               Open --------- Today ---------------- MediumBlue(Fat)
//               High/Low ----- Today ---------------- Yellow
//               pHigh/pLow --- Yesterday ------------ Red/Green
//               ppHigh/ppLow - Day before Yesterday - Red/Green
//               pClose ------- Yesterday ------------ Blue
//               ppClose ------ Day before Yesterday - Blue
//
//
// It is possible to change: - Daily Open on/off
//                           - Daily Open color
//                           - Daily High/Low color
//
//               -- Free to use --
//                     MaVe
// ---- Version:  Sunday31Jan201
//
using System;
using cAlgo.API;
using cAlgo.API.Internals;
using cAlgo.API.Indicators;
using cAlgo.Indicators;

namespace cAlgo.Indicators
{
    [Indicator(IsOverlay = true, AutoRescale = false, TimeZone = TimeZones.UTC, AccessRights = AccessRights.None)]
    public class MaVeTripleDailyOHLC : Indicator
    {
        [Parameter("Daily High/Low Color", DefaultValue = "Yellow")]
        public string DailyHighLowColor { get; set; }
        [Parameter("Show Daily Open", DefaultValue = false)]
        public bool ShowDailyOpen { get; set; }
        private Colors dailyHLcolor;
// ------------------------------------------------------
        protected override void Initialize()
        {
            Enum.TryParse(DailyHighLowColor, out dailyHLcolor);
        }
// ------------------------------------------------------
        public override void Calculate(int index)
        {
            DateTime today = MarketSeries.OpenTime[index].Date;
            DateTime today1 = today.AddDays(1);
            DateTime today2 = today.AddDays(2);
            DateTime today3 = today.AddDays(3);
            double high = MarketSeries.High.Last(0);
            double low = MarketSeries.Low.Last(0);
            double open = MarketSeries.Open[index + 1];
            double close = MarketSeries.Close[index];
            for (int i = MarketSeries.Close.Count - 1; i > 0; i--)
            {
                if (MarketSeries.OpenTime[i].Date < today)
                    break;
                high = Math.Max(high, MarketSeries.High[i]);
                low = Math.Min(low, MarketSeries.Low[i]);
            }
// ----- Triple DailyHighLow
            ChartObjects.DrawLine("High" + today, today, high, today1, high, dailyHLcolor, 1);
            ChartObjects.DrawLine("Low" + today, today, low, today1, low, dailyHLcolor, 1);
            ChartObjects.DrawText("High-text", "High", index, high, VerticalAlignment.Bottom, HorizontalAlignment.Right, dailyHLcolor);
            ChartObjects.DrawText("Low-Text", "Low", index, low, VerticalAlignment.Top, HorizontalAlignment.Right, dailyHLcolor);
            ChartObjects.DrawLine("pHigh" + today, today1, high, today2, high, Colors.Green, 1, LineStyle.Lines);
            ChartObjects.DrawLine("pLow" + today, today1, low, today2, low, Colors.Red, 1, LineStyle.Lines);
            ChartObjects.DrawLine("ppHigh" + today, today2, high, today3, high, Colors.Green, 1, LineStyle.DotsRare);
            ChartObjects.DrawLine("ppLow" + today, today2, low, today3, low, Colors.Red, 1, LineStyle.DotsRare);
// ----- PreviousClose
            ChartObjects.DrawLine("pClose" + today, today1, close, today2, close, Colors.Blue, 1, LineStyle.Lines);
            ChartObjects.DrawLine("ppClose" + today, today2, close, today3, close, Colors.Blue, 1, LineStyle.DotsRare);
// ----- DailyOpen
            if (!ShowDailyOpen)
                return;
            ChartObjects.DrawLine("Open" + today, today1, open, today2, open, Colors.MediumBlue, 2);
        }
    }
}
@MaVe
MaVe
31 Jan 2016, 22:19
- Time set at UTC +0
- Indicator TimeZone = TimeZones.UTC
- First bar on sunday 22:05, second bar, 22:06, ... 22:07, ,...
- First bar on monday 00:00, second bar, 00:01, ... 00:02, ...
Time settings are correct.
My question is: what do I have to change at the code, to get it right?
@MaVe
MaVe
27 Jan 2016, 13:14
( Updated at: 21 Dec 2023, 09:20 )
Another approach for the moment:
Still based on the example /forum/whats-new/913#4
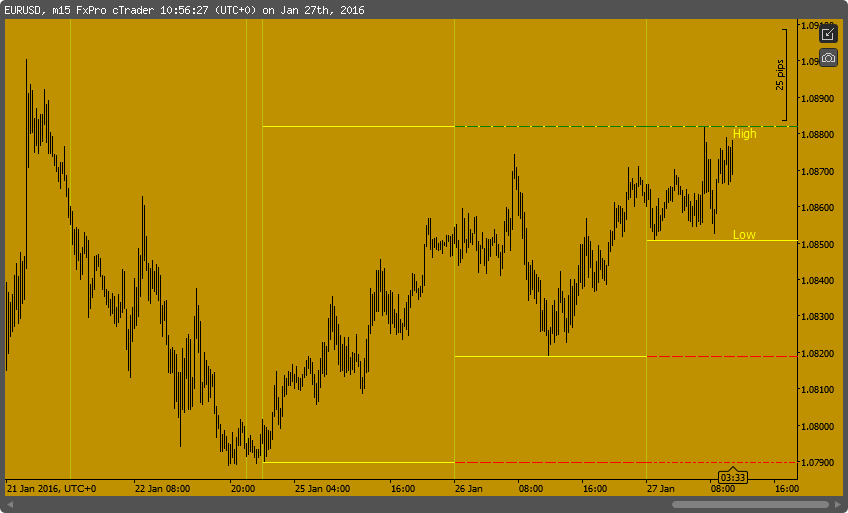
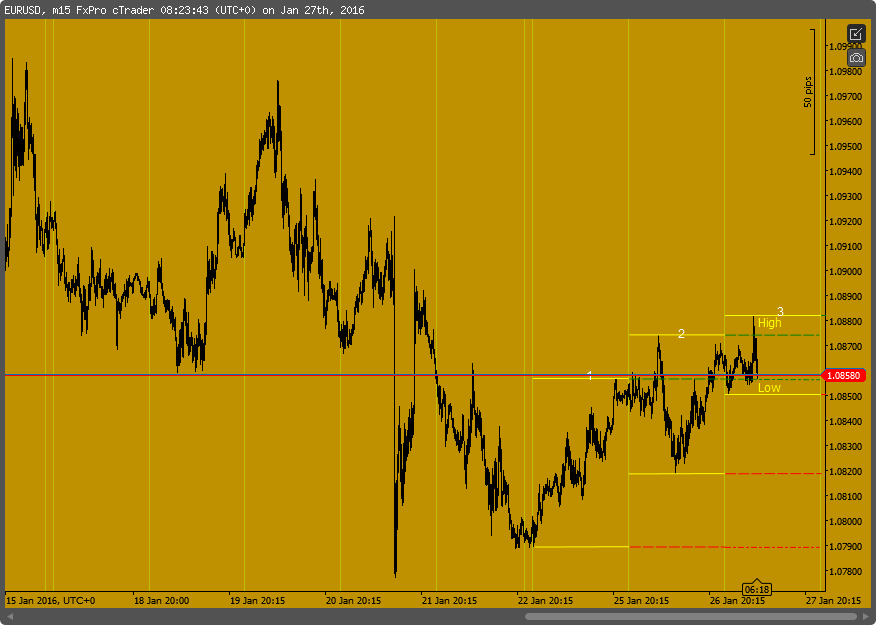
When I draw all the necessary lines separately, The result looks as seen on the chart below.
However, at the moment, the Yesterday high line and TheDayBeforeYesterday high line move up with the today's high.
Where is the failure in the code below??

// Testversion
using System;
using cAlgo.API;

namespace cAlgo.Indicators
{
    [Indicator(IsOverlay = true, AutoRescale = false, TimeZone = TimeZones.UTC, AccessRights = AccessRights.None)]
    public class TripleDailyHL : Indicator
    {
        public override void Calculate(int index)
        {
            DateTime today = MarketSeries.OpenTime[index].Date;
            DateTime today1 = today.AddDays(1);
            DateTime today2 = today.AddDays(2);
            DateTime today3 = today.AddDays(3);
            DateTime previous1 = today.AddDays(-1);
            DateTime previous2 = today.AddDays(-2);
            DateTime previous3 = today.AddDays(-3);

            double high1 = MarketSeries.High.Last(2);
            double low1 = MarketSeries.Low.Last(2);
            double high2 = MarketSeries.High.Last(1);
            double low2 = MarketSeries.Low.Last(1);
            double high = MarketSeries.High.Last(0);
            double low = MarketSeries.Low.Last(0);
// ----- Today
            for (int i = MarketSeries.Close.Count - 1; i > 0; i--)
            {
                if (MarketSeries.OpenTime[i].Date < today)
                    break;
                high = Math.Max(high, MarketSeries.High[i]);
                low = Math.Min(low, MarketSeries.Low[i]);
            }
            ChartObjects.DrawLine("HOD-Line3 ", today, high, today1, high, Colors.Yellow, 1);
            ChartObjects.DrawLine("LOD-Line3 ", today, low, today1, low, Colors.Yellow, 1);
            ChartObjects.DrawText("HOD-Text ", "High", index, high, VerticalAlignment.Bottom, HorizontalAlignment.Right, Colors.Yellow);
            ChartObjects.DrawText("LOD-Text ", "Low", index, low, VerticalAlignment.Top, HorizontalAlignment.Right, Colors.Yellow);
// ----- Yesterday
            for (int i = MarketSeries.Close.Count - 1; i > 0; i--)
            {
                if (MarketSeries.OpenTime[i].Date < previous1)
                    break;
                high2 = Math.Max(high2, MarketSeries.High[i]);
                low2 = Math.Min(low2, MarketSeries.Low[i]);
            }
            ChartObjects.DrawLine("HOD-Line2 ", previous1, high2, today, high2, Colors.Yellow, 1);
            ChartObjects.DrawLine("LOD-Line2 ", previous1, low2, today, low2, Colors.Yellow, 1);
            ChartObjects.DrawLine("pHOD-Line2 ", today, high2, today1, high2, Colors.Green, 1, LineStyle.Lines);
            ChartObjects.DrawLine("pLOD-Line2 ", today, low2, today1, low2, Colors.Red, 1, LineStyle.Lines);
// ----- DayBeforeYesterday
            for (int i = MarketSeries.Close.Count - 1; i > 0; i--)
            {
                if (MarketSeries.OpenTime[i].Date < previous2)
                    break;
                high1 = Math.Max(high1, MarketSeries.High[i]);
                low1 = Math.Min(low1, MarketSeries.Low[i]);
            }
            ChartObjects.DrawLine("HOD-Line1 ", previous2, high1, previous1, high1, Colors.Yellow, 1);
            ChartObjects.DrawLine("LOD-Line1 ", previous2, low1, previous1, low1, Colors.Yellow, 1);
            ChartObjects.DrawLine("pHOD-Line1 ", previous1, high1, today, high1, Colors.Green, 1, LineStyle.Lines);
            ChartObjects.DrawLine("pLOD-Line1 ", previous1, low1, today, low1, Colors.Red, 1, LineStyle.Lines);
            ChartObjects.DrawLine("ppHOD-Line1 ", today, high1, today1, high1, Colors.Green, 1, LineStyle.LinesDots);
            ChartObjects.DrawLine("PPLOD-Line1 ", today, low1, today1, low1, Colors.Red, 1, LineStyle.LinesDots);

        }
    }
}
@MaVe
MaVe
26 Jan 2016, 21:07
RE:
Dear Spotware,
To be more specific: I want to be able to modify my first published Indicator:
/algos/indicators/show/1083
As such:
- Only 3 Daily High Low lines visible (today, yesterday, day before yesterday)
- These 3 Daily High/Low Lines are each projected 2 days in the future.
Is there another example to explain the logic of using the coordinates,
because it is not clear to me at the moment how to implement it.
@MaVe


MaVe
02 Feb 2016, 14:00
Maybe you can try this:
/algos/indicators/show/1104
and this too:
/algos/indicators/show/1116
@MaVe