Value cTrader charts is different than actual value of indicator
25 Jul 2019, 10:59
Hello everyone:
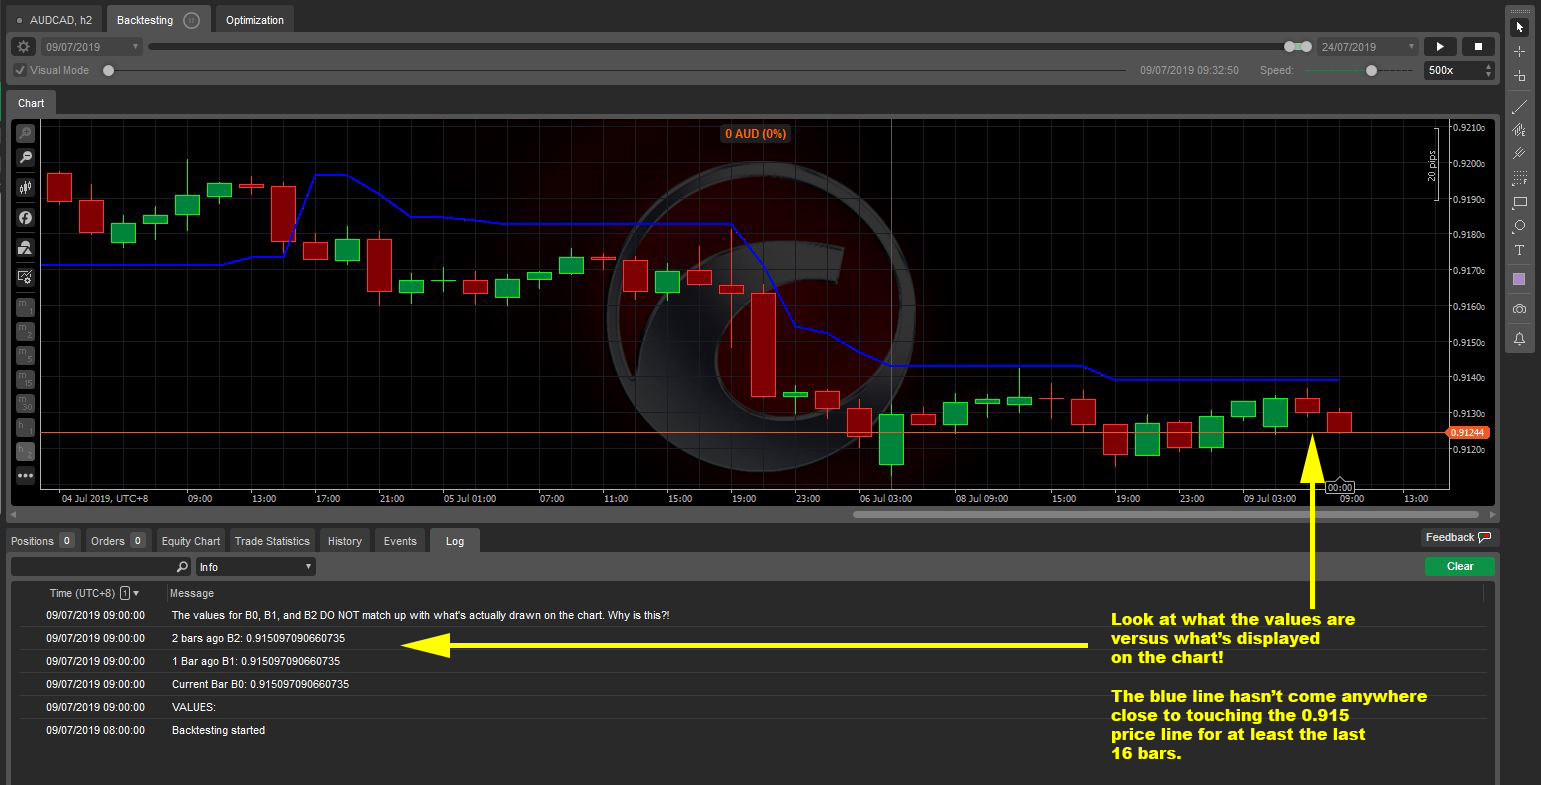
See below screen capture and sample bot code. The values graphed by cTrader are not the values that the indicator is returning as evident by the log.
using System;
using System.Collections;
using System.Collections.Generic;
using System.Diagnostics;
using System.Linq;
using System.Runtime.InteropServices;
using System.Threading;
using System.Threading.Tasks;
using System.Timers;
using cAlgo.API;
using cAlgo.API.Indicators;
using cAlgo.API.Internals;
using cAlgo.Indicators;
using Microsoft.Win32;

namespace cAlgo.Robots
{
    [Robot(TimeZone = TimeZones.UTC, AccessRights = AccessRights.FullAccess)]
    public class BugBot : Robot
    {
        private MarketSeries _marketSeries;
        private Supertrend _superTrend = new Supertrend();
        private string _positionLabel = "bug test";

        //Run this code against AUDCAD H2 July 9th - 24, 2019.
        //For the SuperTrend indicator, only display the "Main" (Result) line.
        //
        //You will see the big discrpetancy between what's printed as the values
        //for b0, b1, b2, versus what cTrader actually charts.
        //
        //Why is this?!

        protected override void OnStart()
        {
            _superTrend = Indicators.GetIndicator<Supertrend>(13, 2.5);
        }

        protected override void OnBar()
        {
            GetLatestIndicatorData();
            double b0 = _superTrend.Result.Last(0);
            double b1 = _superTrend.Result.Last(1);
            double b2 = _superTrend.Result.Last(2);

            Print("VALUES:");
            Print("Current Bar B0: {0}", b0);
            Print("1 Bar ago B1: {0}", b1);
            Print("2 bars ago B2: {0}", b2);
            Print("The values for B0, B1, and B2 DO NOT match up with what's actually drawn on the chart. Why is this?!");
        }

        private void GetLatestIndicatorData()
        {
            double a = _superTrend.Result.Last(0);
            a = _superTrend.Result.Last(1);
            a = _superTrend.Result.Last(2);
        }

    }
}
Replies
firemyst
25 Jul 2019, 11:54
( Updated at: 21 Dec 2023, 09:21 )
RE:
Panagiotis Charalampous said:
Hi FireMyst.
We discussed the same issue here
Best Regards,
Panagiotis
Yes, you are right :-)
However, two points which is why I think this is different:
1) what's the purpose of this setting then?
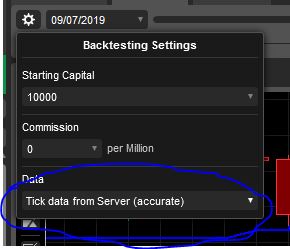
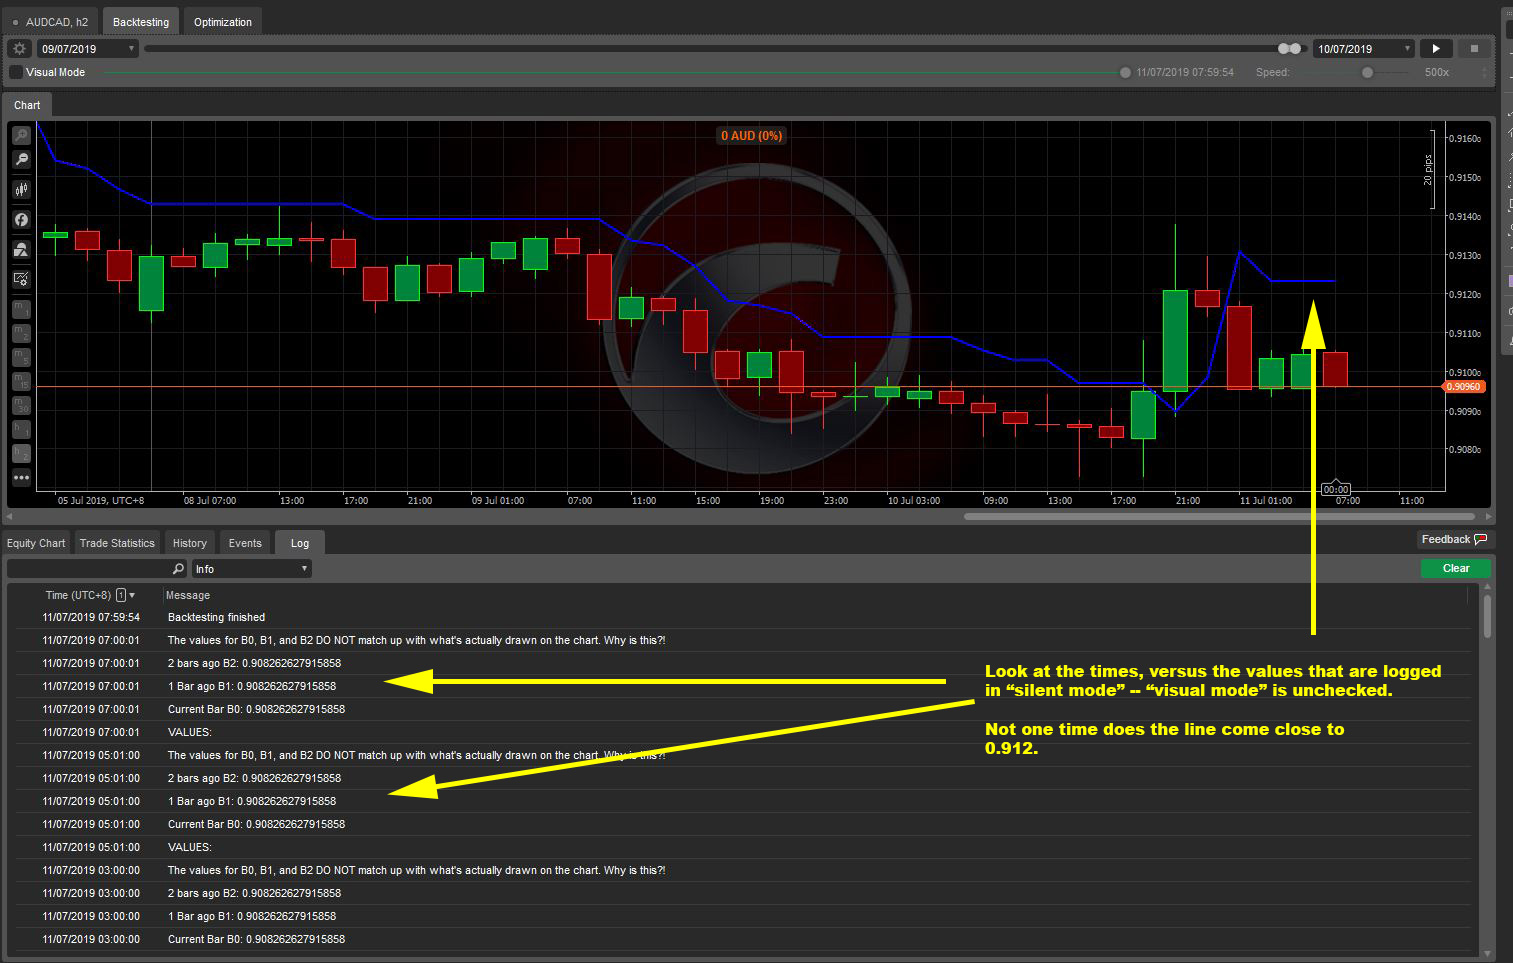
2) I did do this in silent backtesting as well. That is, I have "visual mode" unticked (assuming that's what you mean?). See the results below. Still the same issue. Work backwards in the log and you'll see the values printed don't match up with what's charted:
@firemyst
PanagiotisCharalampous
25 Jul 2019, 12:05
Hi FireMyst,
Same explanation applies. The values you get in the log are the correct since all ticks are considered. The values you see on the chart are not as accurate as some ticks are skipped.
Best Regards,
Panagiotis
@PanagiotisCharalampous
firemyst
25 Jul 2019, 17:54
( Updated at: 21 Dec 2023, 09:21 )
RE:
Panagiotis Charalampous said:
Hi FireMyst,
Same explanation applies. The values you get in the log are the correct since all ticks are considered. The values you see on the chart are not as accurate as some ticks are skipped.
Best Regards,
Panagiotis
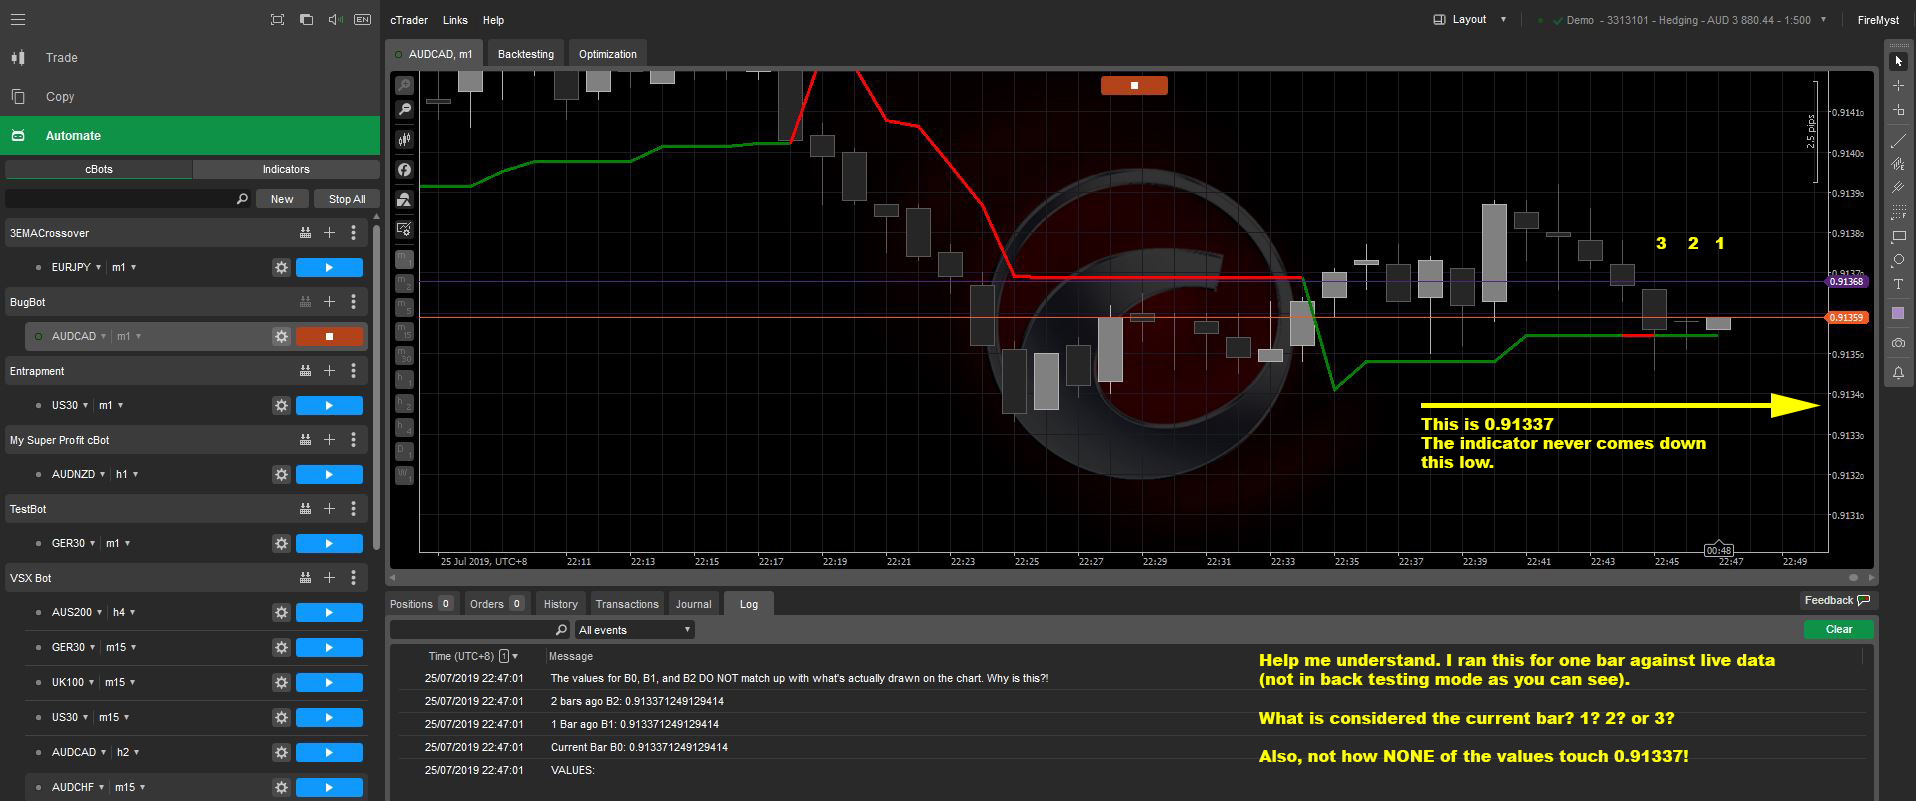
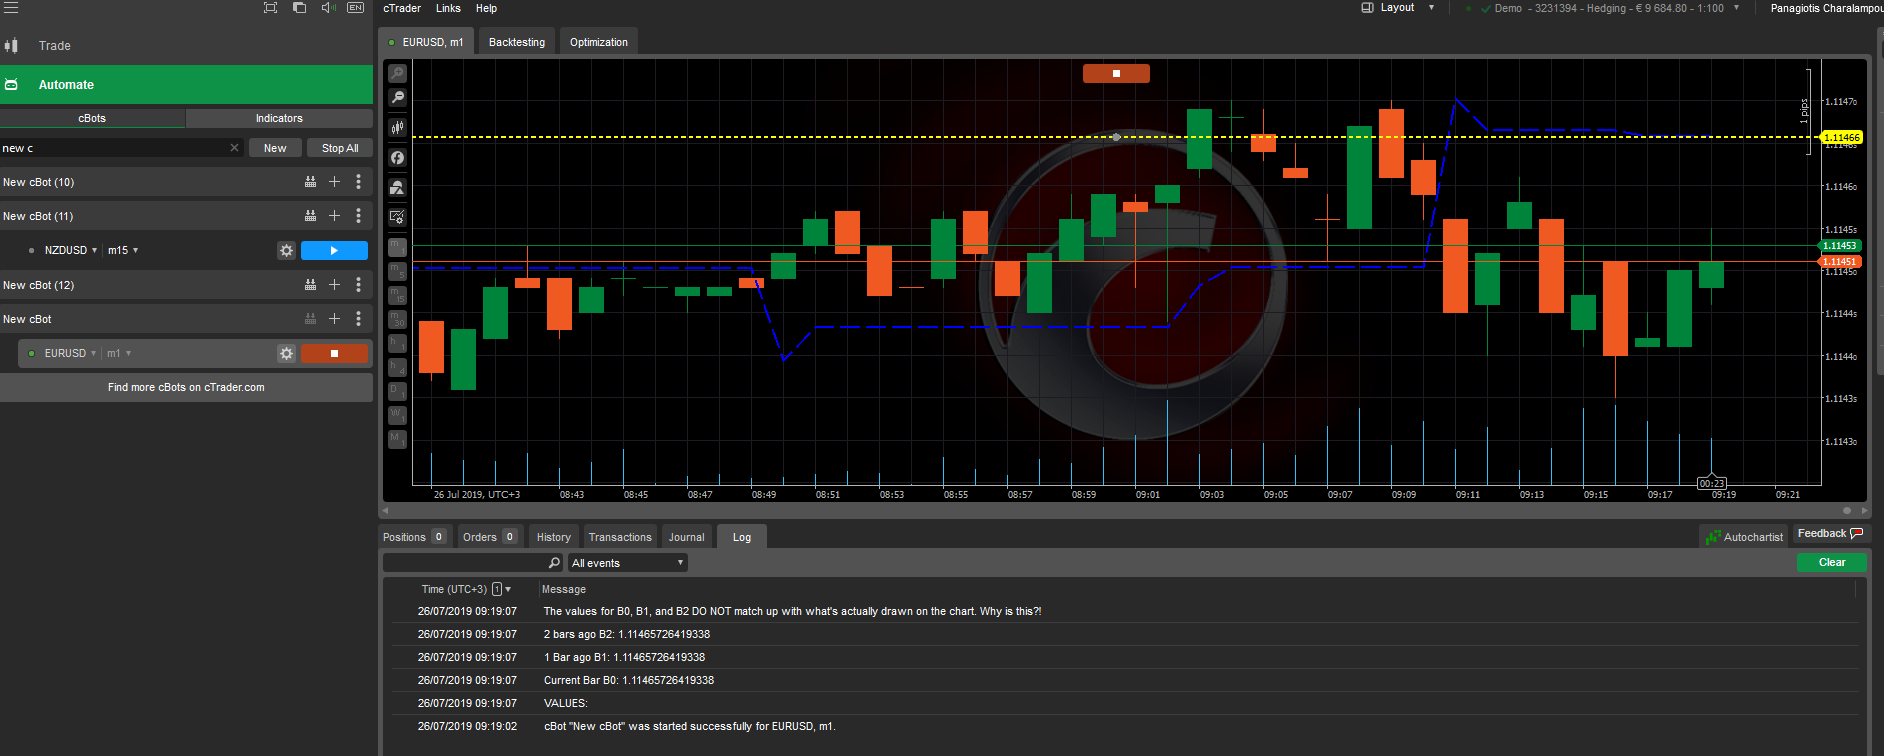
So I ran it "live", not in backtesting mode, as you can see below.
1) Is this what you mean by "live execution"?
2) Just so we're on the same page, which bar is considered the current bar? 1? 2? or 3?
Notice in none of the cases does the indicator get drawn down to the 0.91337 level as logged!
3) Still not an issue? I'm convinced it is because running it like this live, the indicator should show me the exact values on the chart - not "skipping" any ticks.
@firemyst
PanagiotisCharalampous
26 Jul 2019, 09:23
( Updated at: 21 Dec 2023, 09:21 )
Hi FireMyst,
This is what I get. Seems fine
Are you sure you are using the same indicator with the same parameters? Because it doesn't to me. The indicator in your image has two colors while the indicator in the post does not have such a feature.
Best Regards,
Panagiotis
@PanagiotisCharalampous
firemyst
26 Jul 2019, 09:43
RE:
Panagiotis Charalampous said:
Are you sure you are using the same indicator with the same parameters? Because it doesn't to me. The indicator in your image has two colors while the indicator in the post does not have such a feature.Best Regards,
Panagiotis
Yes, I am using same indicator. Sorry for the confusion. The indicator has options to show "uptrend" and "downtrend" in different colors, or a "main" line which keeps it with one color.
As I was going to email you the code, I just noticed in the code that I had the parameters hard-coded in one portion of the bot and were different than the display paramter of the indicator on the chart.
I'm so sorry for wasting your time @Panagiotis. Grrr... talk about feeling stupid now. Thank you for your patience. :-)
@firemyst
PanagiotisCharalampous
26 Jul 2019, 09:46
Hi FireMyst,
The indicator you are showing has UpTrend and DownTrend values. In your code you use Result
            GetLatestIndicatorData();
            double b0 = _superTrend.Result.Last(0);
            double b1 = _superTrend.Result.Last(1);
            double b2 = _superTrend.Result.Last(2);
Also the multiplier you are showing is 1.5. In the code you have 2.5
_superTrend = Indicators.GetIndicator<Supertrend>(13, 2.5);
Best Regards,
Panagiotis
@PanagiotisCharalampous
firemyst
26 Jul 2019, 09:57
RE:
Panagiotis Charalampous said:
Hi FireMyst,
The indicator you are showing has UpTrend and DownTrend values. In your code you use Result
            GetLatestIndicatorData();
            double b0 = _superTrend.Result.Last(0);
            double b1 = _superTrend.Result.Last(1);
            double b2 = _superTrend.Result.Last(2);
Also the multiplier you are showing is 1.5. In the code you have 2.5
_superTrend = Indicators.GetIndicator<Supertrend>(13, 2.5);Best Regards,
Panagiotis
You're absolutely right. See my edited post above.
@firemyst

PanagiotisCharalampous
25 Jul 2019, 11:06
Hi FireMyst.
We discussed the same issue here
Best Regards,
Panagiotis
@PanagiotisCharalampous