Thank you for reporting this issue. Unfortunately we were not able to reproduce this behavior. Could you pleasesend us some troubleshooting information the next time this happens? Please paste a link to this discussion inside the text box before you submit it.
Share your cBot code andsend us some troubleshooting information the next time this happens. Please paste a link to this discussion inside the text box before you submit it.
Best regards,
Panagiotis
Ok sent…I sent it from another user's cTrader but please refer to me for follow up. Thanks you.
Hi there,
We need the troubleshooting for the session that experiences the problem. Can you please send it again?
Unfortunately there is no way to set names for lines manually drawn on the chart.
Best regards,
Panagiotis
Hello,
Thank you for responding. If i want to create an algo with two mannually drawn trendlines (line-A and line-B). Logic is if the price crossed below Line-A buy the ticker and if the price touches the Line-B close the position.
Is this possible to implement? this needs algo to read the mannuaaly drawn trendline, identify it and calculate the price based on the line. Point me if there are any examples/documentation on this on how to implement this.
Hi there,
Yes it is possible to do this but there is no specific documentation for this since this is rudimentary algebra and not a cTrader specific issue. A trendline's equation is ax+b, you need to use it to find the value of the trendline on each bar and determine if the price has crossed it or not.
Best regards,
Panagiotis
if im drawing the line on the chart mannually (NOT via algo),
how i can get values of a,x,b in the algo for that line?
If i draw multiple lines on the chart (mannually), how can distinguish between the lines? As i can see when i draw a line on the chart, i cant name the line
Hi there,
ChartTrendLine has Time1, Time1, Y1(start price) and Y2(end price) properties. You can use them to calculate a,x and b.
There is no easy way to do this. Names for the lines are assigned automatically by cTrader.
Can you provide a better explanation of the problem? What do you mean when you say “is too large”? How can we see this?
Best regards,
Panagiotis
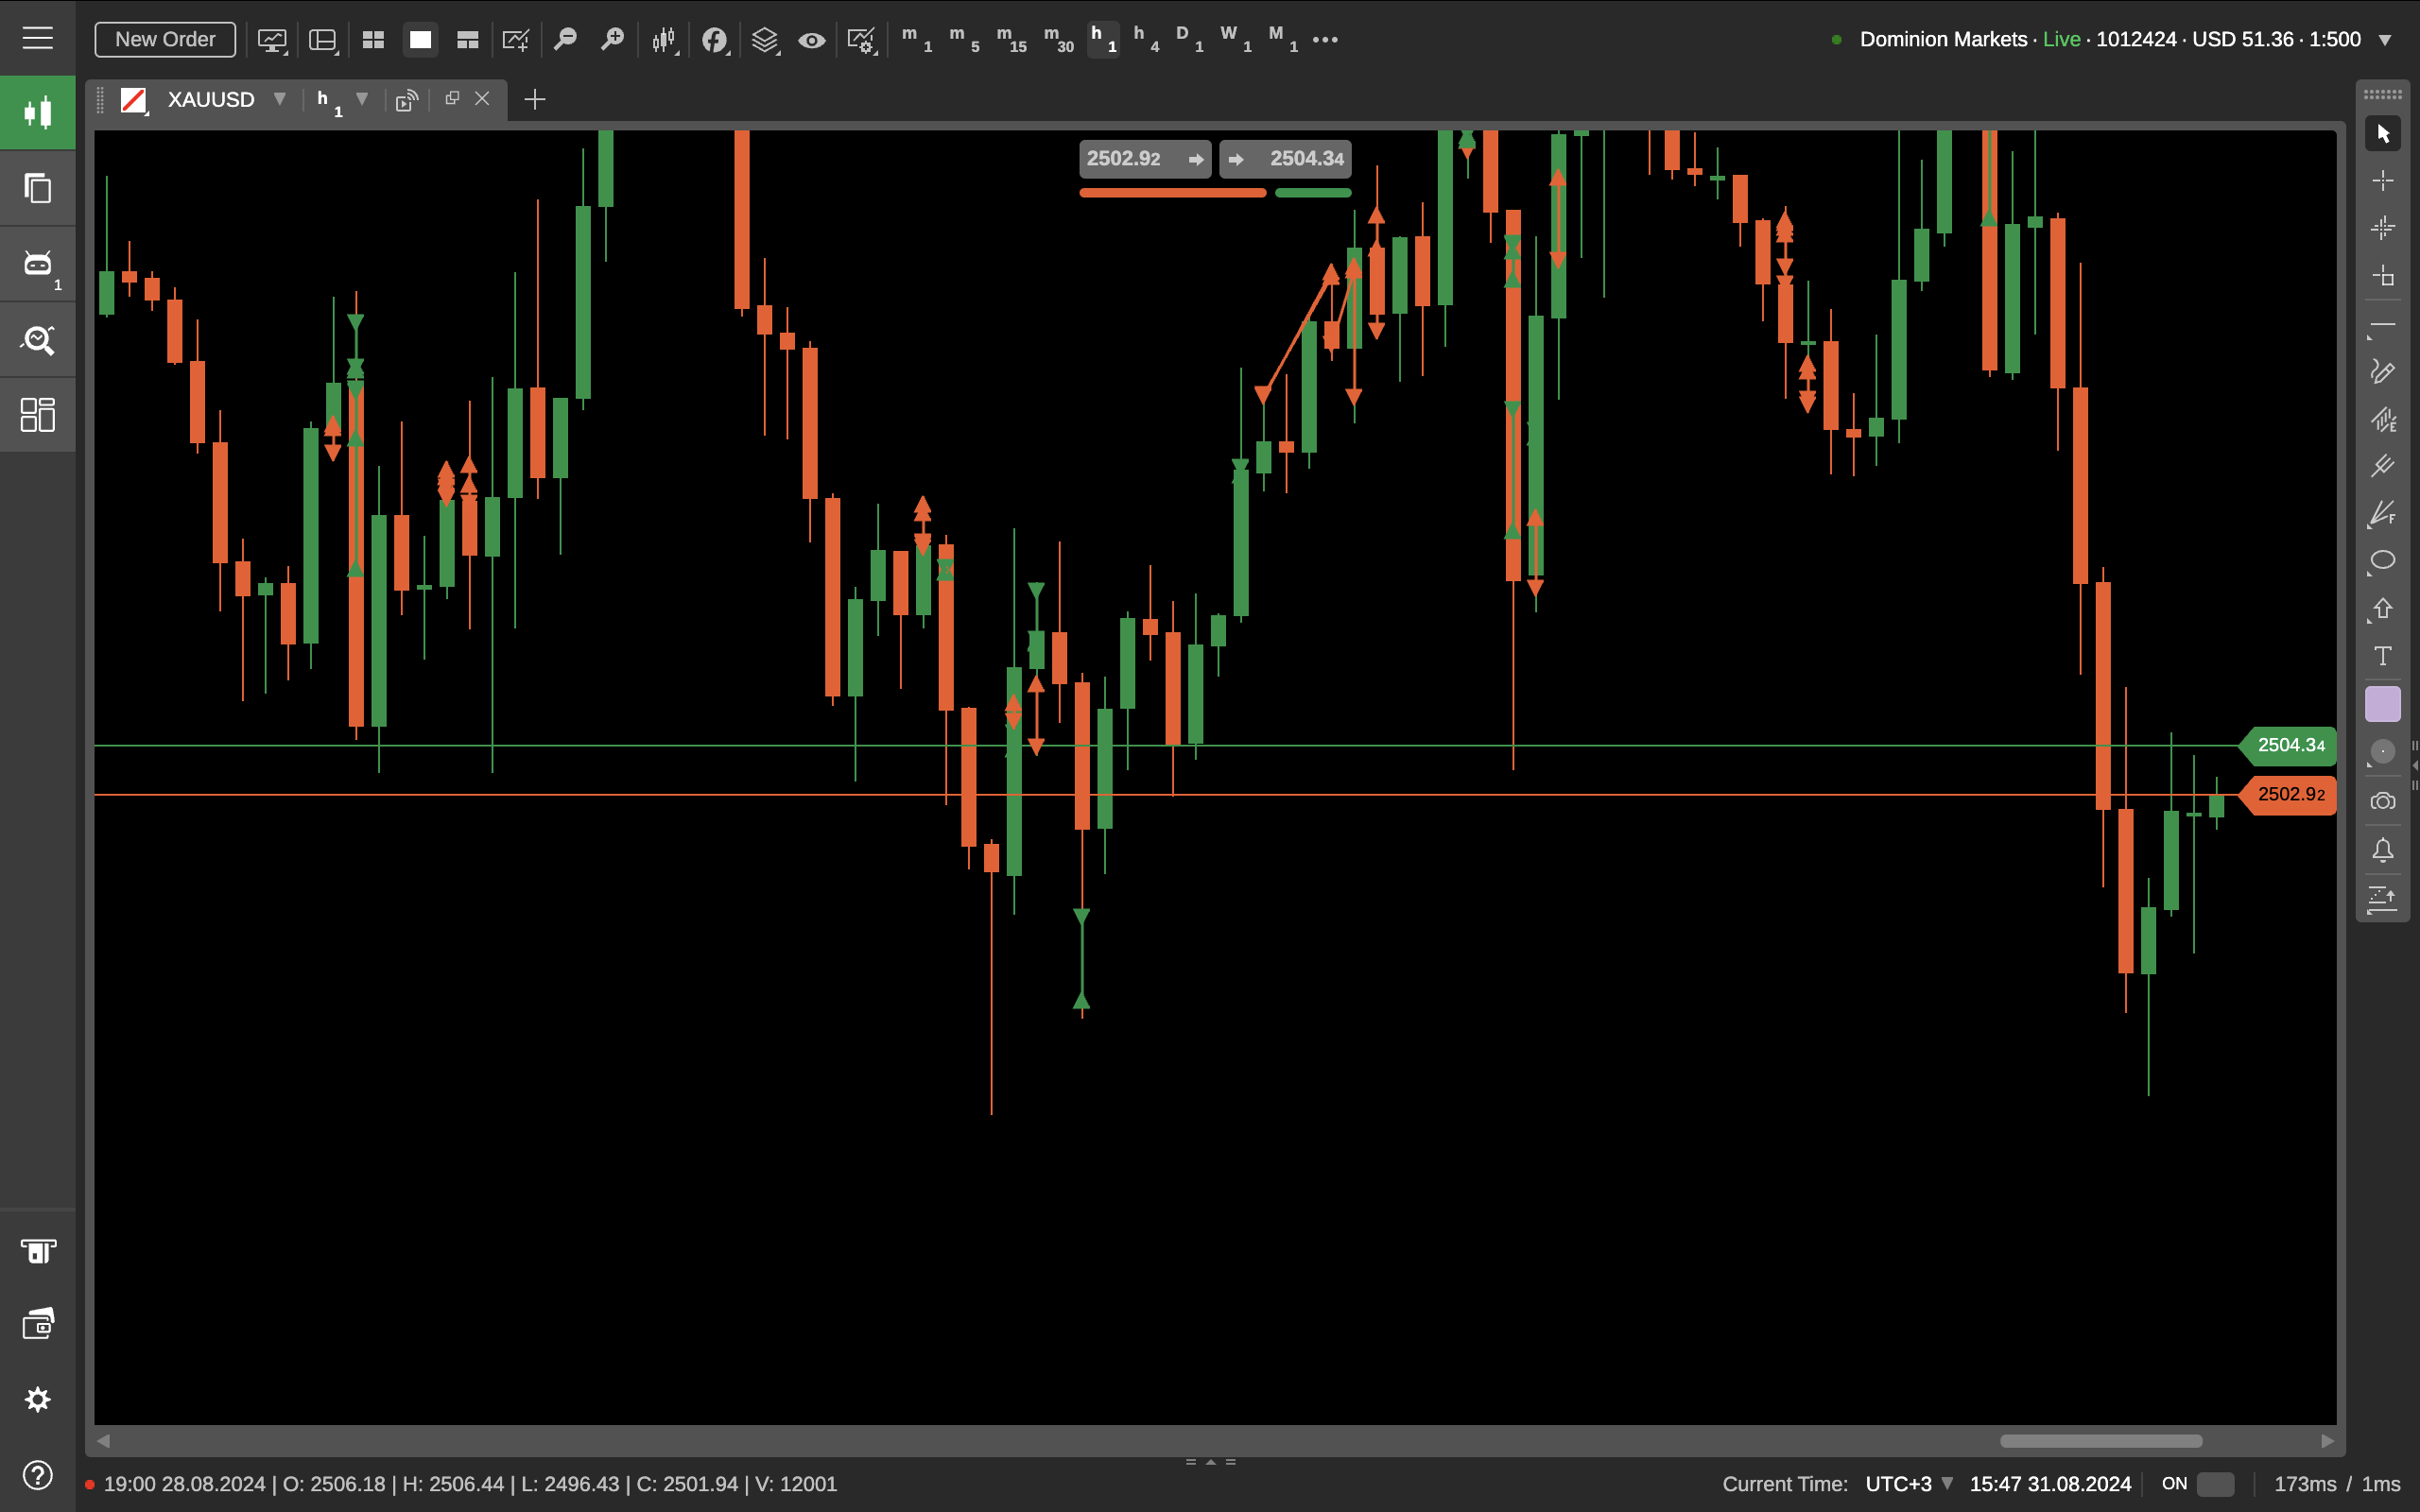
The longer the horizontal bar in the red box, the fewer the number of candlesticks in the chart, and the shorter, the more. The short one represents the M1 chart, which has too many candle sticks. I hope it could be like a range chart, where more K-line data is downloaded only when you drag it to the left. Without dragging, only a part of the candle sticks are displayed. The number of candle sticks in the M1 chart is very large when the software is opened. I hope it could be as few as the range chart. When I want to see more data, I can just drag it to left.
Hi there,
There is no way to reduce the number of loaded bars at the moment. However I cannot reproduce any delays. Can you provide more information? Can you record a video where we can see what you are experiencing?
There is no simple way at the moment. You would need to build your own store and licensing system. There is a plan for a cTrader Store but it will not come any time soon.
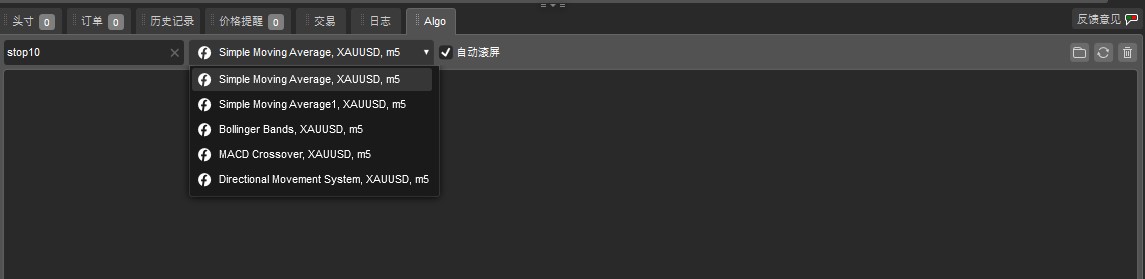
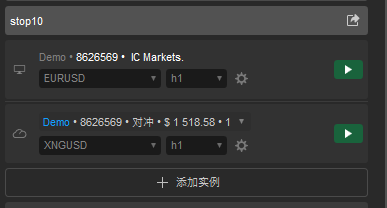
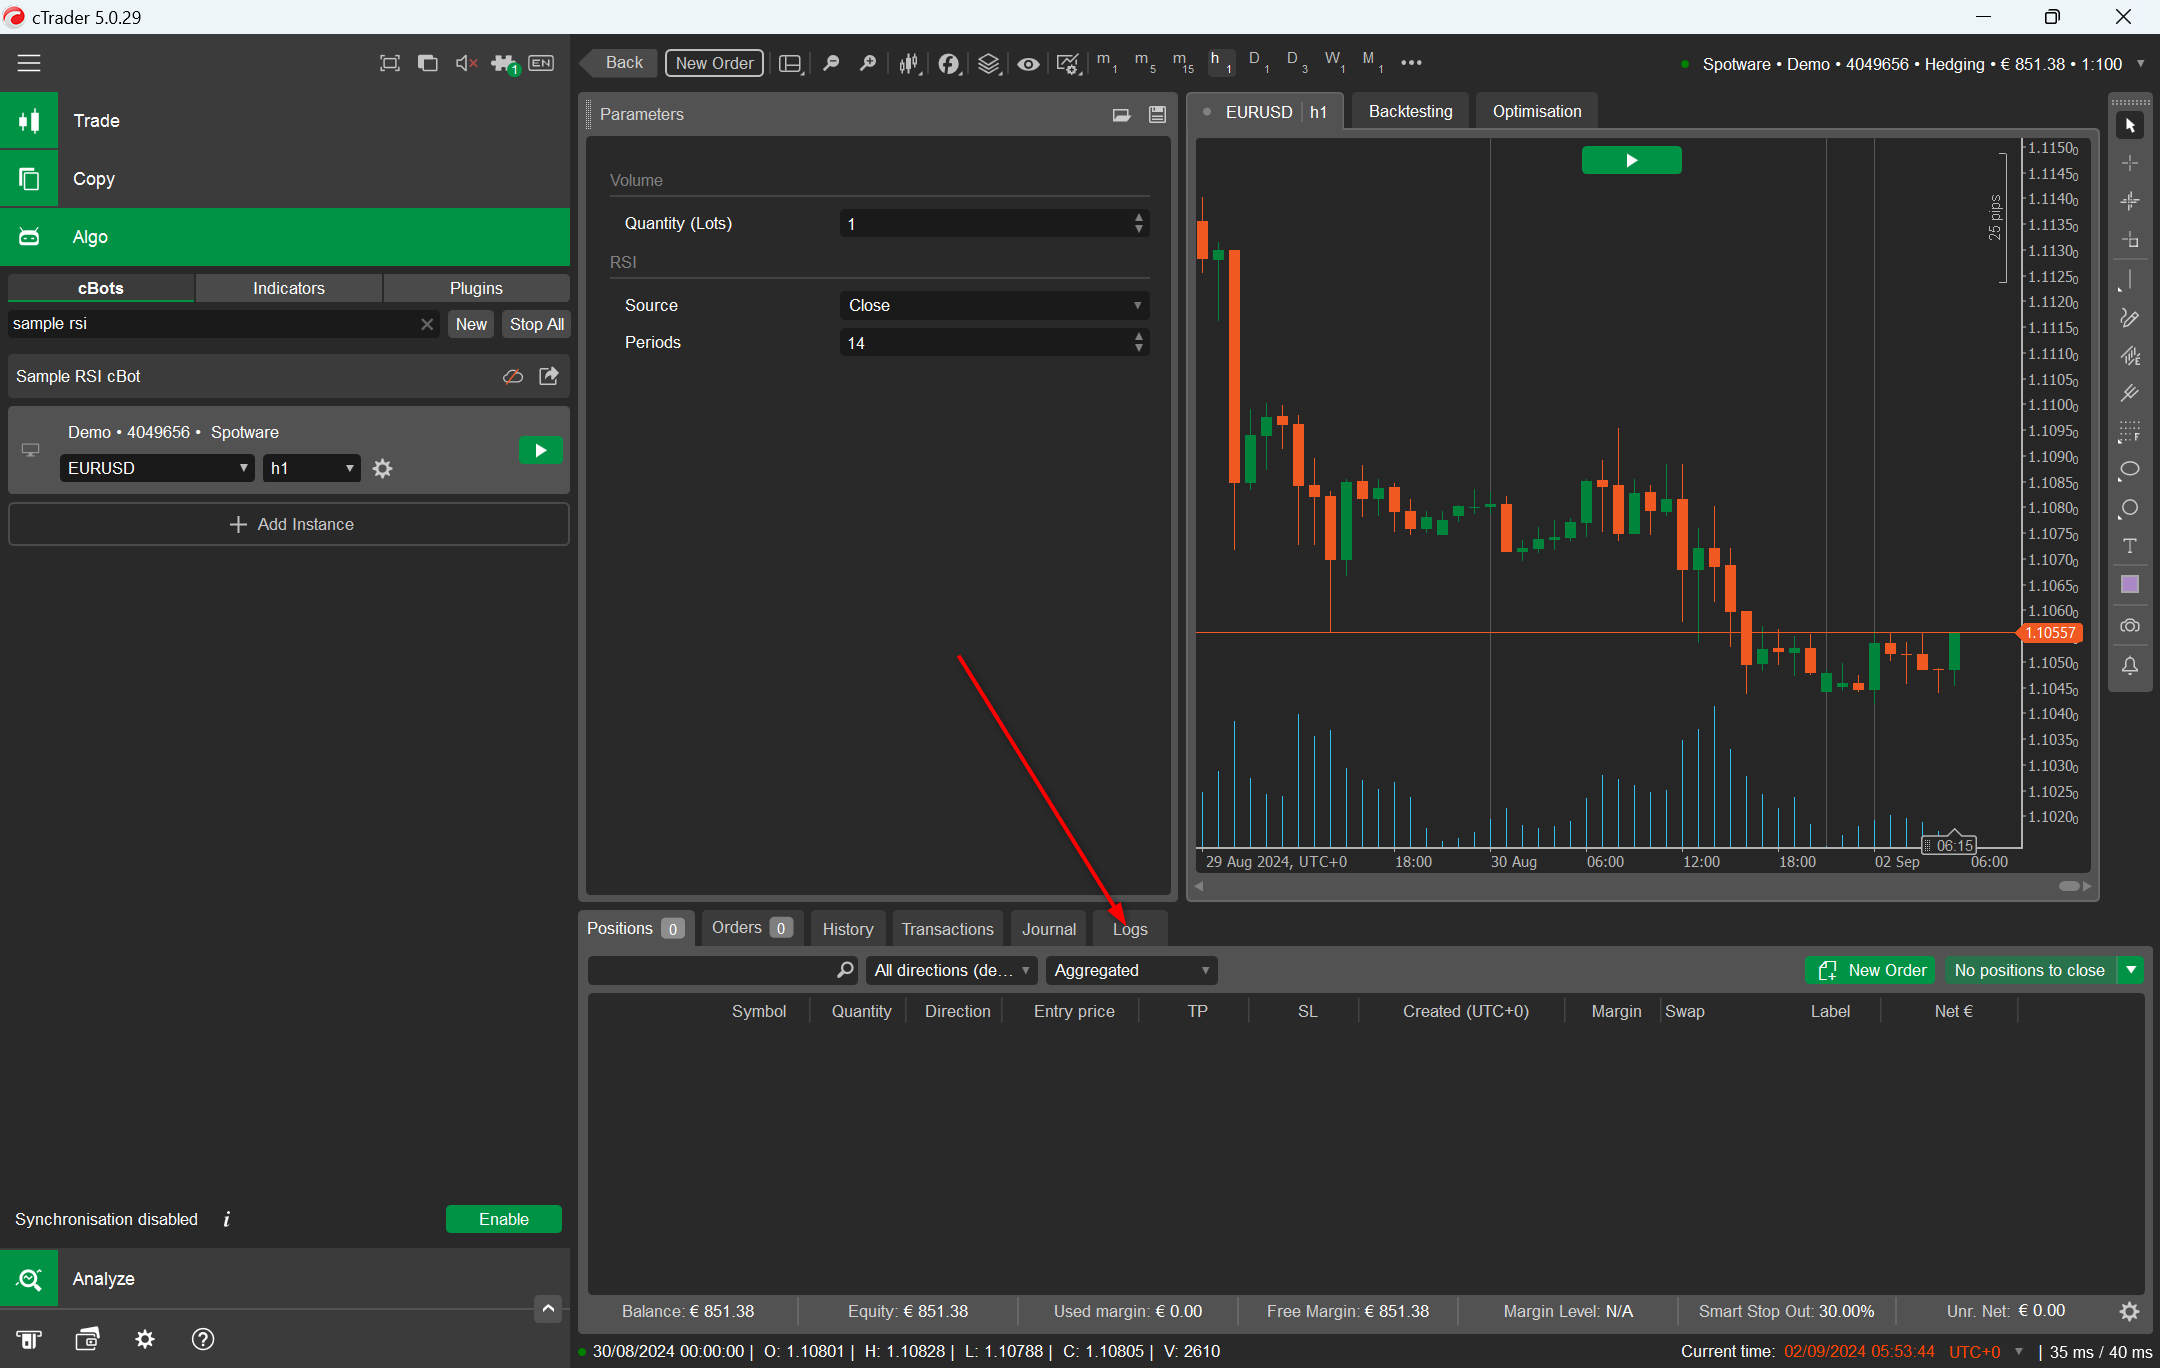
As shown in the image, my cbot is called “stop10”, but I can't find it in the dropdown list as you mentioned! So where can I find the log of my cbot???
Hi there,
The first screenshot comes from the Trade section, the second comes from the Algo section. If you will run the cBot in the algo section, you will not see the logs in the Trade section but in the Algo section.
Unfortunately there is no way to set names for lines manually drawn on the chart.
Best regards,
Panagiotis
Hello,
Thank you for responding. If i want to create an algo with two mannually drawn trendlines (line-A and line-B). Logic is if the price crossed below Line-A buy the ticker and if the price touches the Line-B close the position.
Is this possible to implement? this needs algo to read the mannuaaly drawn trendline, identify it and calculate the price based on the line. Point me if there are any examples/documentation on this on how to implement this.
Hi there,
Yes it is possible to do this but there is no specific documentation for this since this is rudimentary algebra and not a cTrader specific issue. A trendline's equation is ax+b, you need to use it to find the value of the trendline on each bar and determine if the price has crossed it or not.


PanagiotisCharalampous
03 Sep 2024, 05:23
RE: RE: RE: RE: RE: RE: RE: RE: Backtesting - Incorrect TP / SL calculation
zytotoxiziteat said:
I don't understand what you mean. It's just an option in a dropdown list
@PanagiotisCharalampous