M.
how to show a specific number of an indicator's values as Points
22 Oct 2020, 19:12
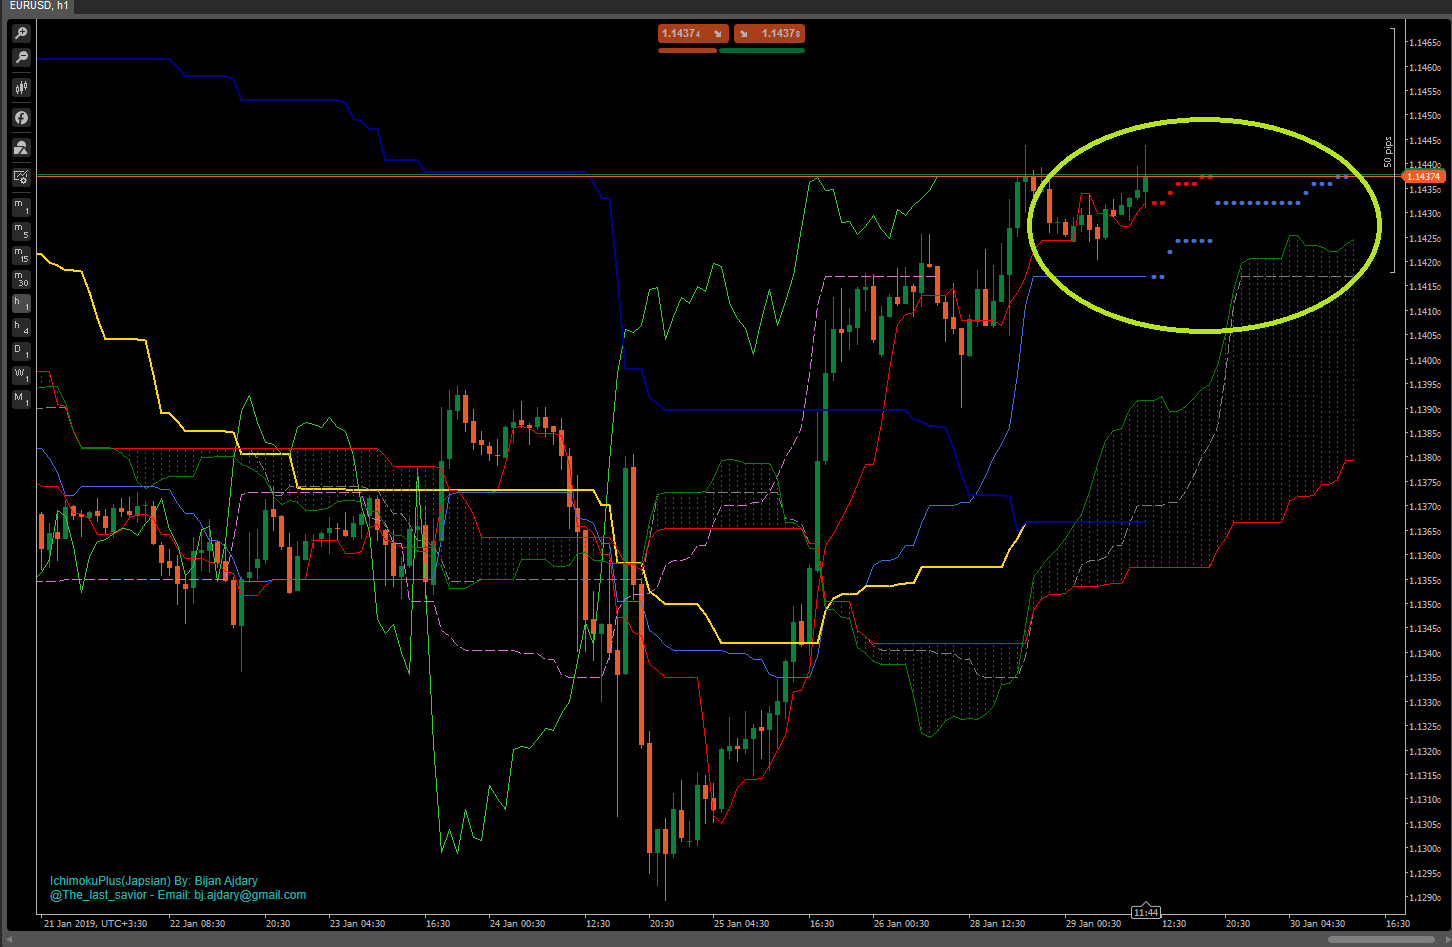
hey, im trying to write an indicator to predict kijun Sen value for 17 candles from now and show them as points,but unlike indicatordataseries,only calculate and show them for last candle,like the picture below,what is the code for this kind of output?

PanagiotisCharalampous
23 Oct 2020, 08:30
Hi m.mohammadreza.m.s,
You can use PlotType.Points to display points on your chart. If you need to show only specific points then you can set all other values to NaN.
Best Regards,
Panagiotis
Join us on Telegram
@PanagiotisCharalampous