Indicator with specified timeframe displays different values on charts with different time frames
Indicator with specified timeframe displays different values on charts with different time frames
07 Sep 2019, 18:21
Hi everyone:
So I was testing creating indicators with their own timeframes so they can be drawn on charts with different time frames.
However, when the timeframe is specified for the indicator, it draws/calculates different values for the main chart's time frame.
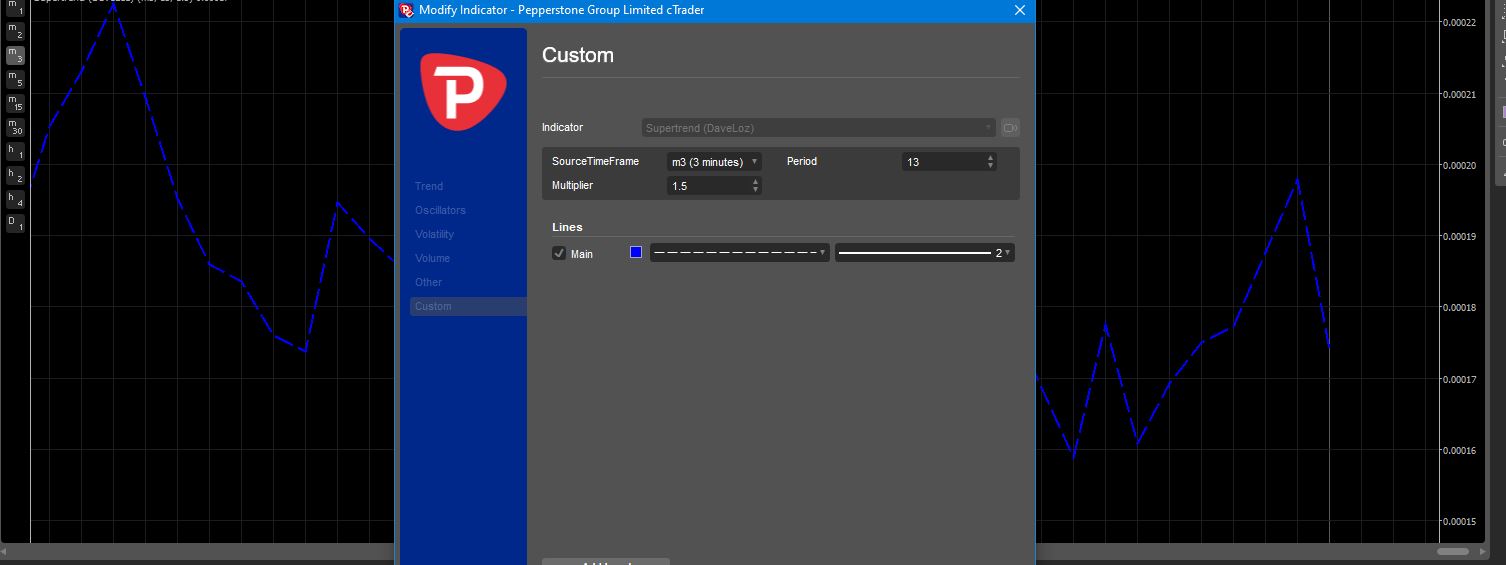
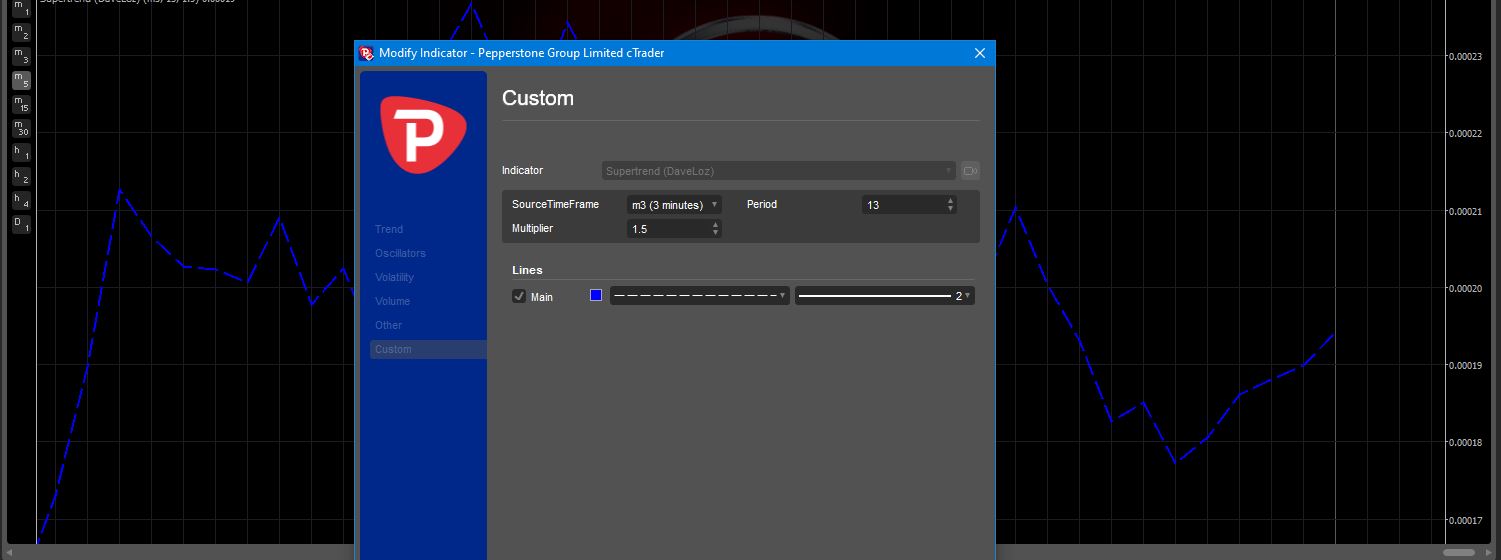
For example, see the following screen captures.
On the M3 chart:

On the M5 chart:

I would have thought the charts should look exactly the same for the indicator because in the code, I'm specifying the Market series data to use as you can see in the code below:
using System;
using System.Collections.Generic;
using cAlgo.API;
using cAlgo.API.Indicators;
using cAlgo.API.Internals;

namespace cAlgo.Indicators
{
    [Indicator("TEST", IsOverlay = false, AccessRights = AccessRights.None, TimeZone = TimeZones.UTC)]
    public class TESTIndicator : Indicator
    {
        [Parameter()]
        public TimeFrame SourceTimeFrame { get; set; }

        [Parameter(DefaultValue = 1.5)]
        public double Multiplier { get; set; }

        [Parameter(DefaultValue = 13)]
        public int Period { get; set; }

        [Output("Main", PlotType = PlotType.Line, LineStyle = LineStyle.Lines, LineColor = "Blue", Thickness = 2)]
        public IndicatorDataSeries Result { get; set; }

        private AverageTrueRange _averageTrueRange;
        private MarketSeries _marketSeries;

        protected override void Initialize()
        {
            if (SourceTimeFrame != null)
                _marketSeries = MarketData.GetSeries(Symbol.Name, SourceTimeFrame);
            else
		_marketSeries = MarketData.GetSeries(Symbol.Name, MarketSeries.TimeFrame);

            _averageTrueRange = Indicators.AverageTrueRange(_marketSeries, Period, MovingAverageType.Exponential);
        }

        public override void Calculate(int index)
        {
            if (index < 0)
                return;
            Result[index] = _averageTrueRange.Result[index];
        }
    }
}
The configs for the indicator in both charts is to use the M3 time frame as you can see in the screen captures.
So why are the charts displaying different values?
Thank you.
Replies
firemyst
10 Sep 2019, 03:38
RE:
Panagiotis Charalampous said:
Hi FireMyst,
The charts are displaying different values because you are using the wrong index. Replace line 41 to the below
Result[index] = _averageTrueRange.Result[_marketSeries.OpenTime.GetIndexByTime(MarketSeries.OpenTime[index])];Best Regards,
Panagiotis
That's awesome.
Thank you so much @Panagiotis! :-)
@firemyst

PanagiotisCharalampous
09 Sep 2019, 11:06
Hi FireMyst,
The charts are displaying different values because you are using the wrong index. Replace line 41 to the below
Best Regards,
Panagiotis
@PanagiotisCharalampous