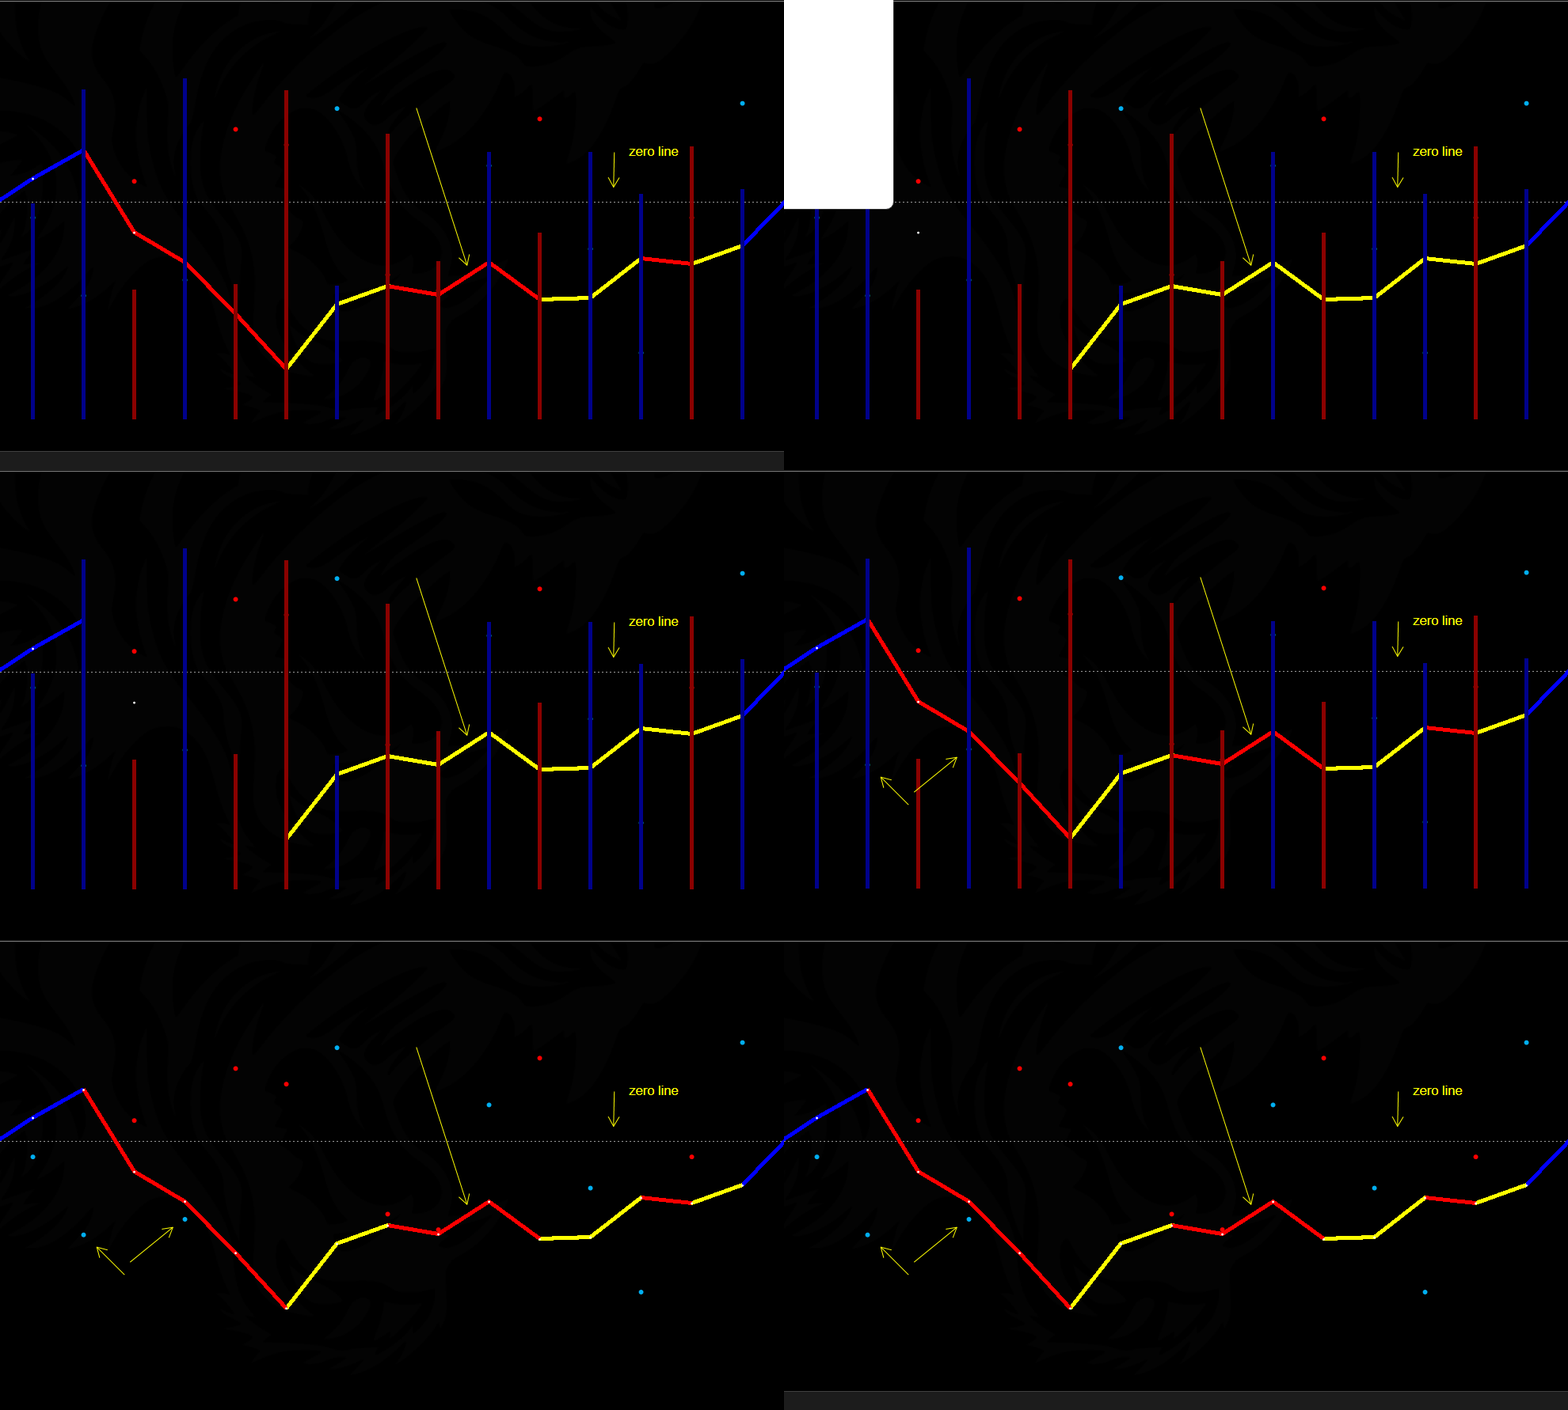
Z-Order for Plots and PlotType.DiscontinuousLine or change color for segment of one Plot
Z-Order for Plots and PlotType.DiscontinuousLine or change color for segment of one Plot
22 Mar 2025, 04:43
Hi there,
new to cAlgo, and I'm trying to rewrite some indicators from another platform, I have currently come across two things
1) is there a way to specify the Z-axis order for Plots?
2) I have 4 Plots, i.e. one for each color, I used PlotType.DiscontinuousLine, unfortunately in cases where adjacent values are from the same plot I am not able to achieve the desired result, i.e. the red segment should not be displayed and the yellow one below it should be displayed
Is there another solution how to change the color according to the value and have only one Plot?
red = decreasing below 0
yellow = increasing below 0
Thanks


firemyst
06 May 2025, 00:01
Welcome to one of Spotware's many poor architectural designs.
@firemyst