Price errors on chart
27 Feb 2022, 01:15
Hi cT
Hope you are well.
From what bit I've learned, I believed that as the price on an instrument varied each point in time was an event frozen in history. So if I look at US30 at a particular time that moment should have a particular price, yet during an analysis I was performing, I noticed that I have two different results on two charts with different time frames.
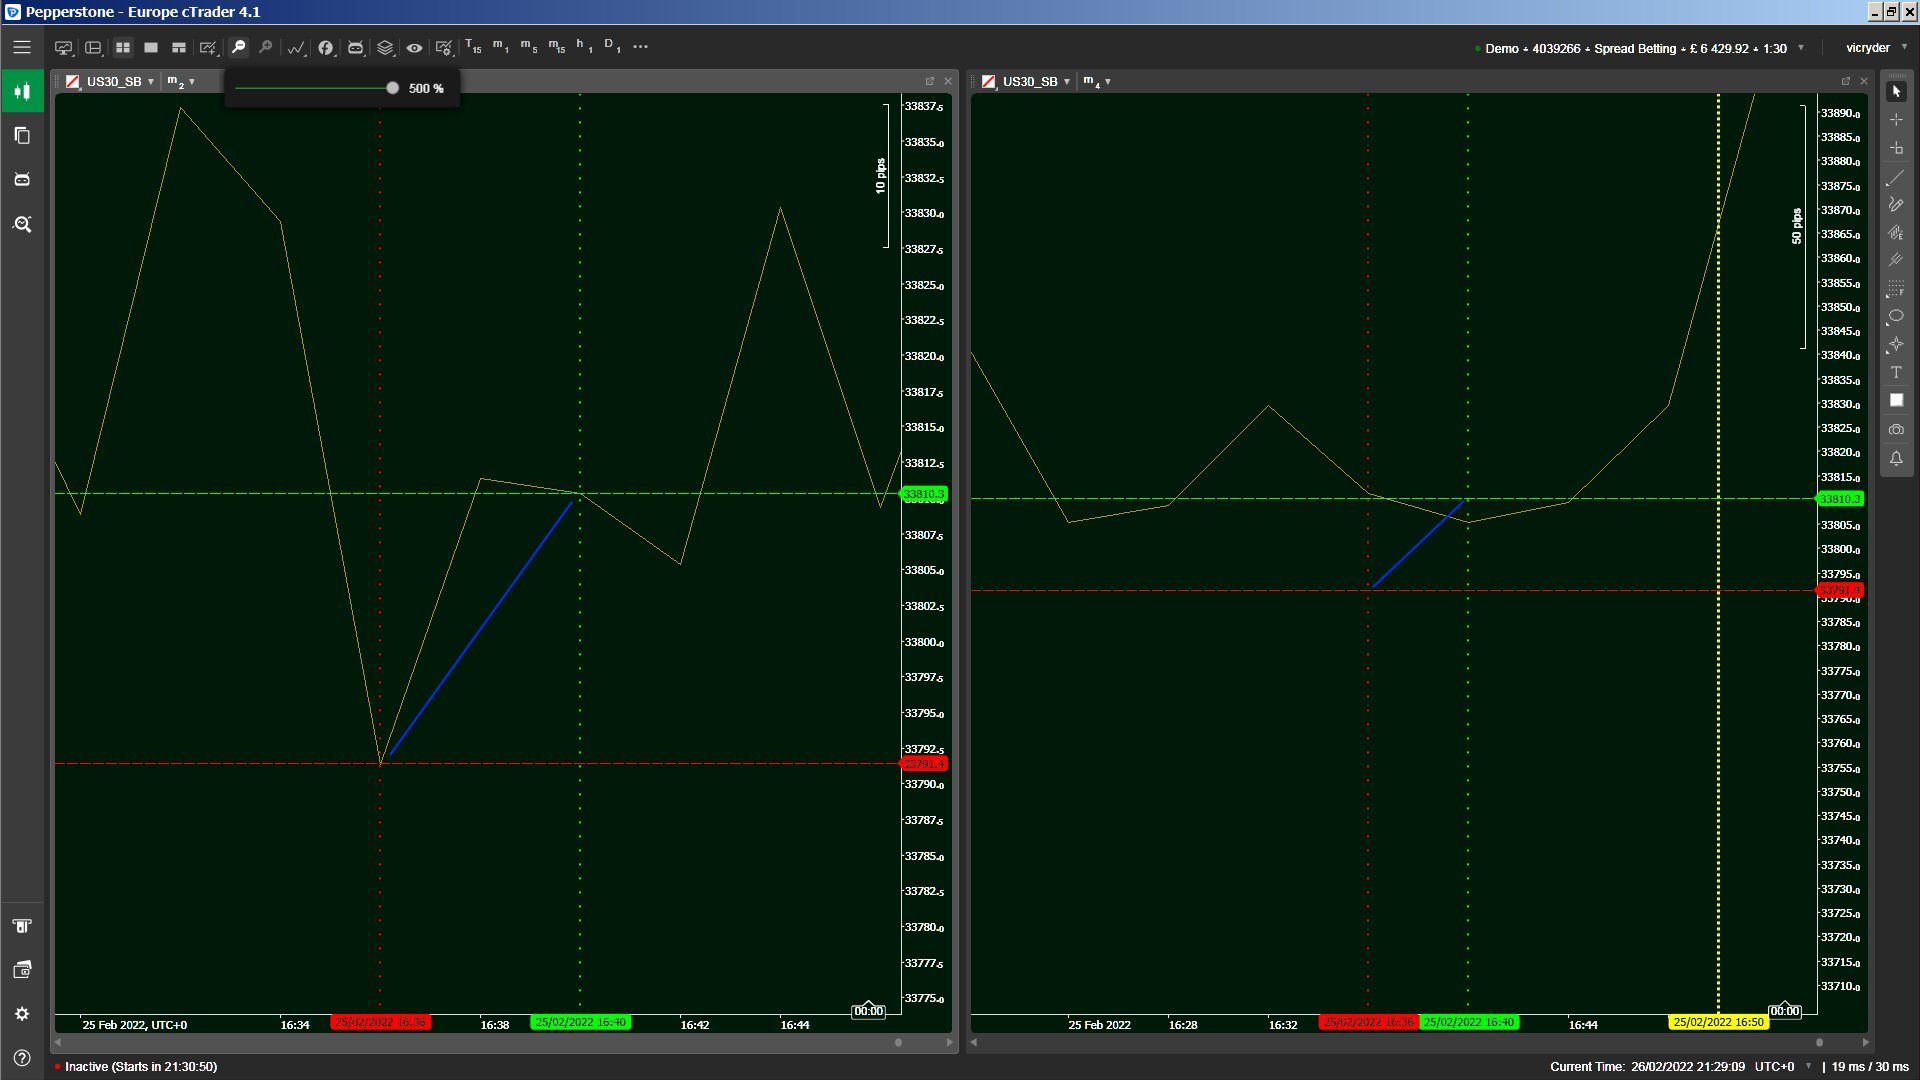
The two charts are 2m and 4m line charts and at a specific moment on the 2m chart it shows a point with a price of 33791.4. The line then shoots upward in the first 2 minutes then slightly downward over the next 2 minutes and I drew a blue line between the start and end points in expectation of what I would find on a 4-minute chart.
I then opened a duplicate chart (to copy over all the drawn lines) and changed the time frame to 4 minutes and was shocked to see that the chart line had gone down instead of up and that neither the start or end point coincided with the points indicated on the 2 minute chart.
I can appreciate there have been hundreds of millisecond ticks in this 4 minutes but I don't see how that could possibly explain why during this 4 minute period the price started at one value and went up 19 pips while on the other chart the price started at a different value and went down 6 pips.
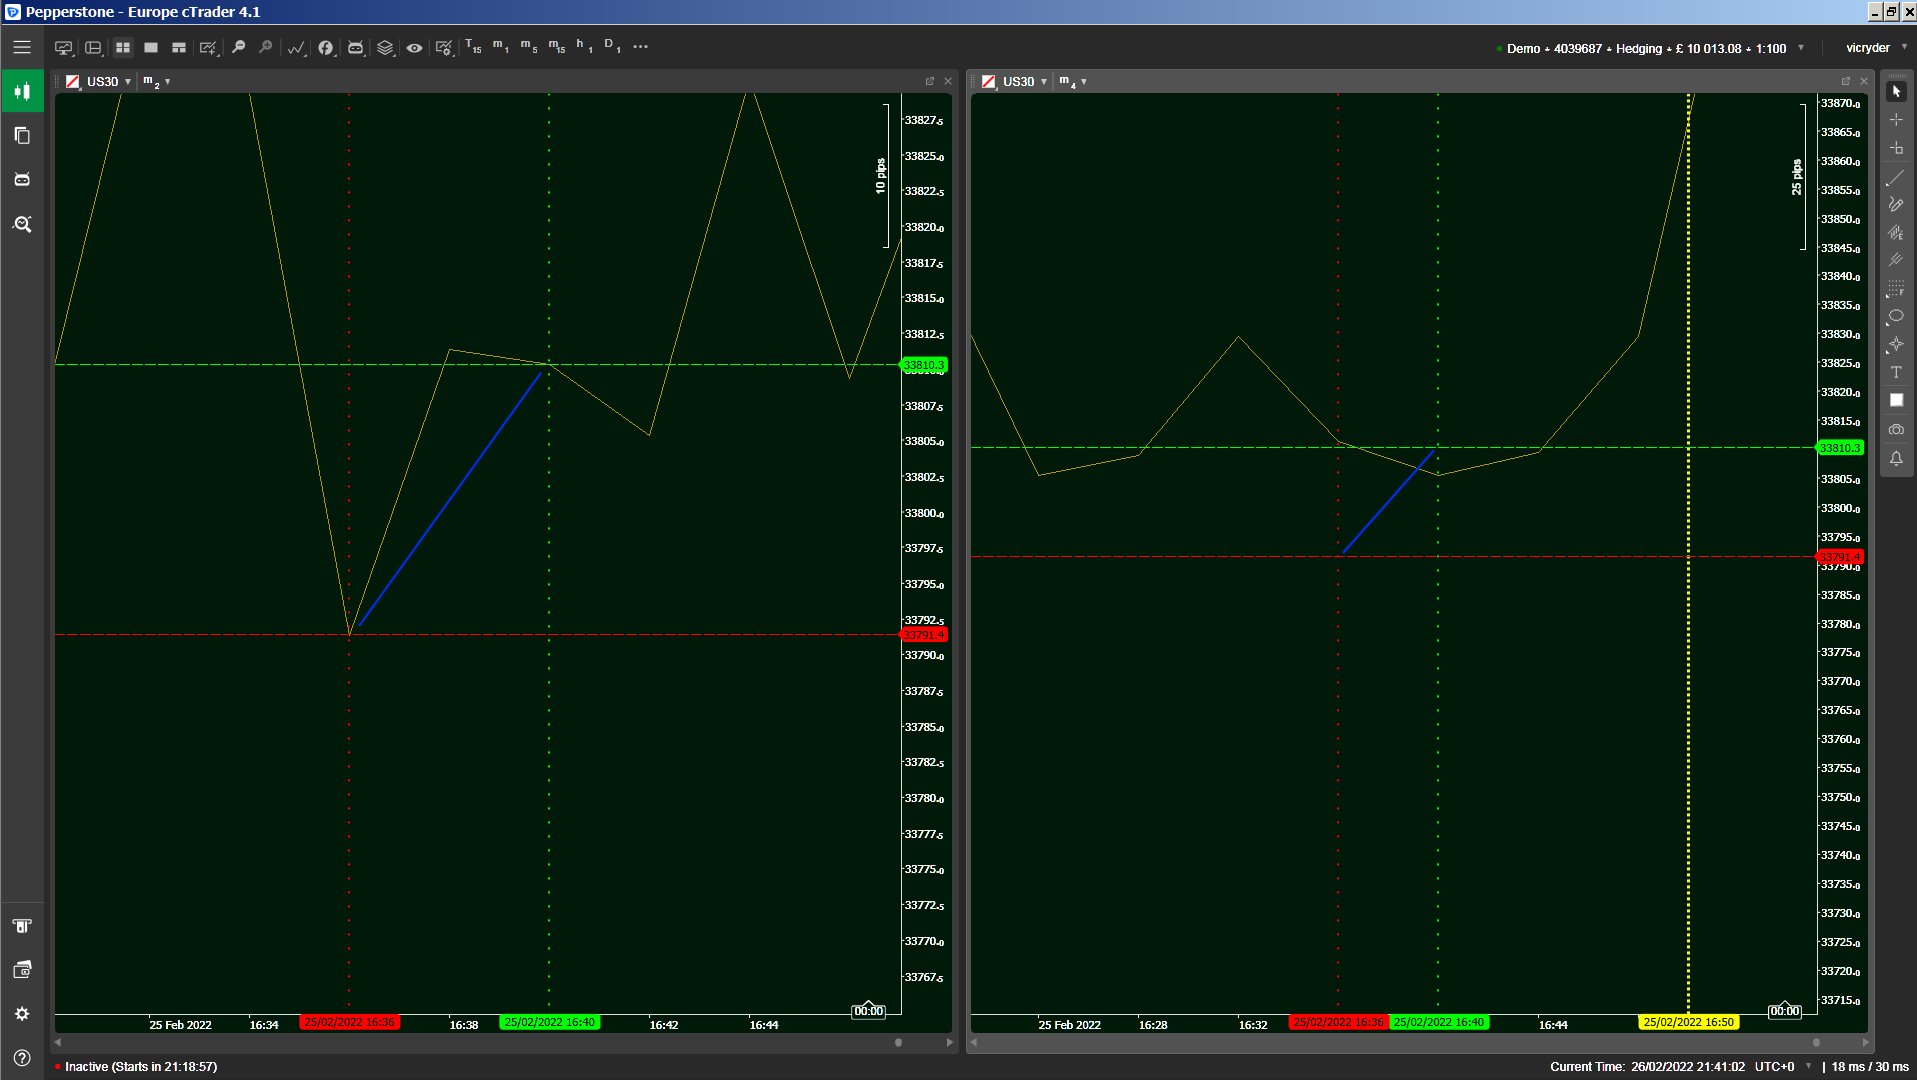
The instrument is US30_SB indicating a spread betting account and when I looked at the US30 on a hedging account the exact same results appear.
Can someone explain this please? (Images included)
PS images not included because I don't see how to add them.
Replies
vicryder
28 Feb 2022, 09:02
( Updated at: 21 Dec 2023, 09:22 )
RE: Price errors on chart
PanagiotisCharalampous said:
Hi vicryder,
You can just copy and paste images inside the text editor.
Best Regards,
Panagiotis
Join us on Telegram and Facebook
~~~~~~~~~~~~~~~~~~~~~~~~~~~~~~~~~~~~~~~~~~~
Thanks Panagiotis.
Following on then, here are the two images.
The first is my original US30_SB A'c charts showing the comparison between the 2m and 4m. The second is the US30 Hedge A'c showing the same problem.
It's just struck me that I did this during the time the market was inactive and that may have caused the effect, but I have just rechecked now on an active market and the same issue still exists.
Surely this can't be correct, can it?
What do you think Panagiotis?
@vicryder


PanagiotisCharalampous
28 Feb 2022, 08:15
Hi vicryder,
You can just copy and paste images inside the text editor.
Best Regards,
Panagiotis
Join us on Telegram and Facebook
@PanagiotisCharalampous