Can't view output from a different timeframe
19 Jan 2021, 15:43
using System;
using System.Collections.Generic;
using cAlgo.API;
using cAlgo.API.Internals;
using cAlgo.API.Indicators;
using cAlgo.Indicators;

namespace cAlgo
{
    [Indicator(IsOverlay = true, AccessRights = AccessRights.None)]
    public class SupportResistance : Indicator
    {

        [Parameter("Bars Period", DefaultValue = 20, Step = 10)]
        public int HighLow_Period { get; set; }

        [Parameter("TimeFrame", DefaultValue = "TimeFrame.Hour")]
        public TimeFrame time_frame { get; set; }

        [Output("Highest", LineColor = "Green", Thickness = 2)]
        public IndicatorDataSeries Highest_Output { get; set; }

        [Output("Lowest", LineColor = "Red", Thickness = 2)]
        public IndicatorDataSeries Lowest_Output { get; set; }

        private double Highest = 0;
        private double Lowest = 0;

        public int source_index;

        private Bars bars_source;
        private DataSeries bars_source_close;
        private DataSeries bars_source_high;
        private DataSeries bars_source_low;

        protected override void Initialize()
        {
            bars_source = MarketData.GetBars(time_frame);
            bars_source_close = bars_source.ClosePrices;
            bars_source_high = bars_source.HighPrices;
            bars_source_low = bars_source.LowPrices;
        }

        public override void Calculate(int index)
        {
            source_index = bars_source_close.Count - 1;
            double close = bars_source_close[source_index];
            double high = bars_source_high[source_index];
            double low = bars_source_low[source_index];

            update_highlow(source_index);
        }

        private void update_highlow(int source_index)
        {
            Highest = 0;
            Lowest = 0;

            var period_start_index = source_index - HighLow_Period;

            if (source_index >= HighLow_Period)
            {

                for (var i = period_start_index; i <= source_index; i++)
                {

                    double period_high = bars_source_high[i];
                    double period_low = bars_source_low[i];

                    Highest = Math.Max(period_high, Highest);
                    Lowest = Lowest == 0 ? period_low : Math.Min(period_low, Lowest);

                    Highest_Output[source_index] = Highest;
                    Lowest_Output[source_index] = Lowest;

                }

            }

        }

    }
}

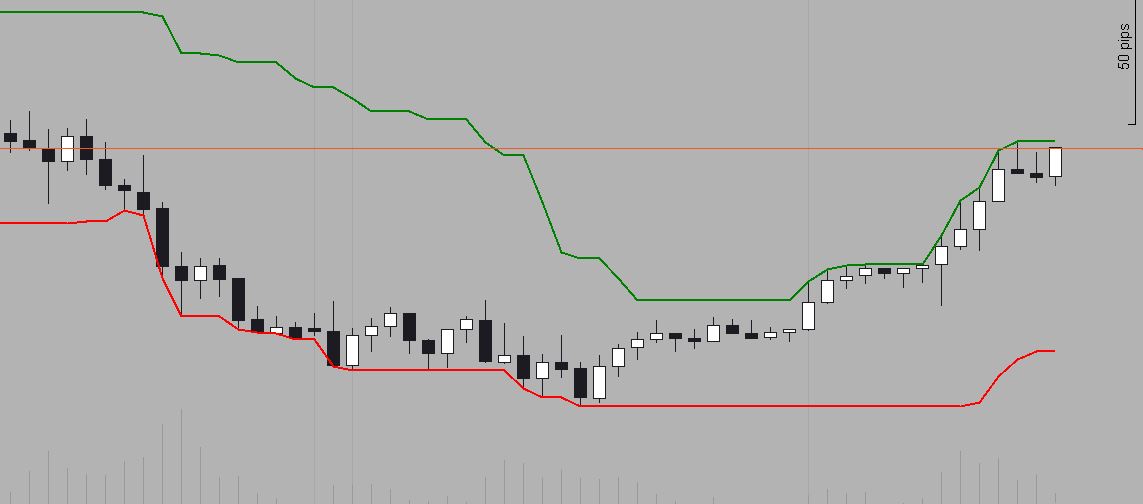
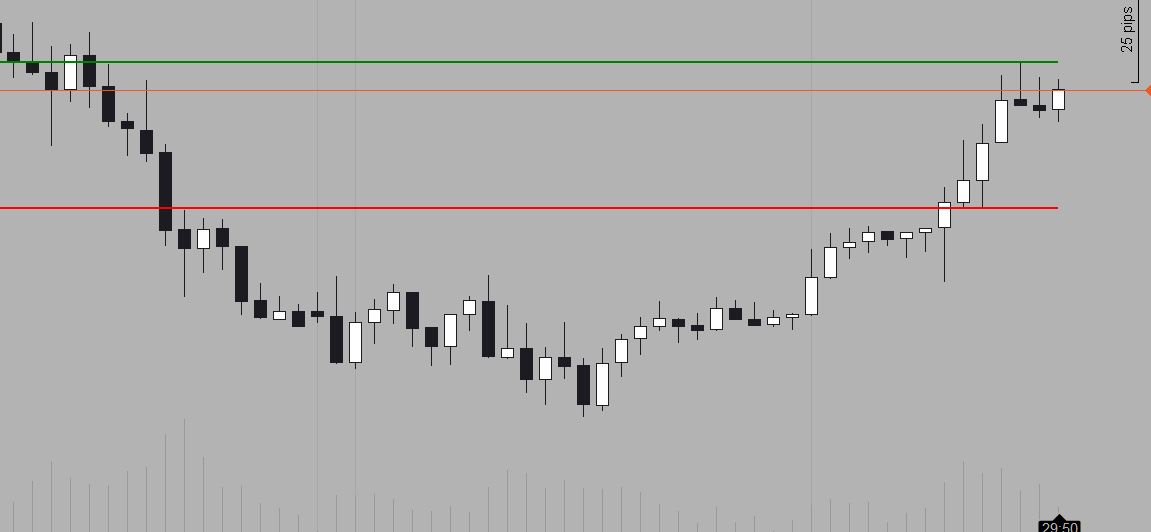
This works fine when I view the in the chart on the same timeframe as the bars_source timeframe, but when I change the chart timeframe different to the bars_source timeframe, the indicator's output lines disappear (the indicatordataseries data is still intact though). It's probably due to the different indexing but when I change the index to 'Highest_Output[index]', the lines appear like this:

and the indicatordataseries data is NaN.
How can I modify the code to allow me to input multiple different timeframes to view both visually and have multiple dataseries (highest and lowest dataseries output) on the same chart (regardless of what timeframe the chart is on), view chart on a 30 minute timeframe bars but have the output lines based on 1 hour timeframe bars?
Thank you.

... Deleted by UFO ...