


A help to resolve the visualization of the macd and the signal on the chart above the candles.

Joined 24.12.2024
A help to resolve the visualization of the macd and the signal on the chart above the candles.
25 Jan 2025, 18:40
Hi. I need help with the following code.
I'll explain briefly what it does and what I would like to fix.
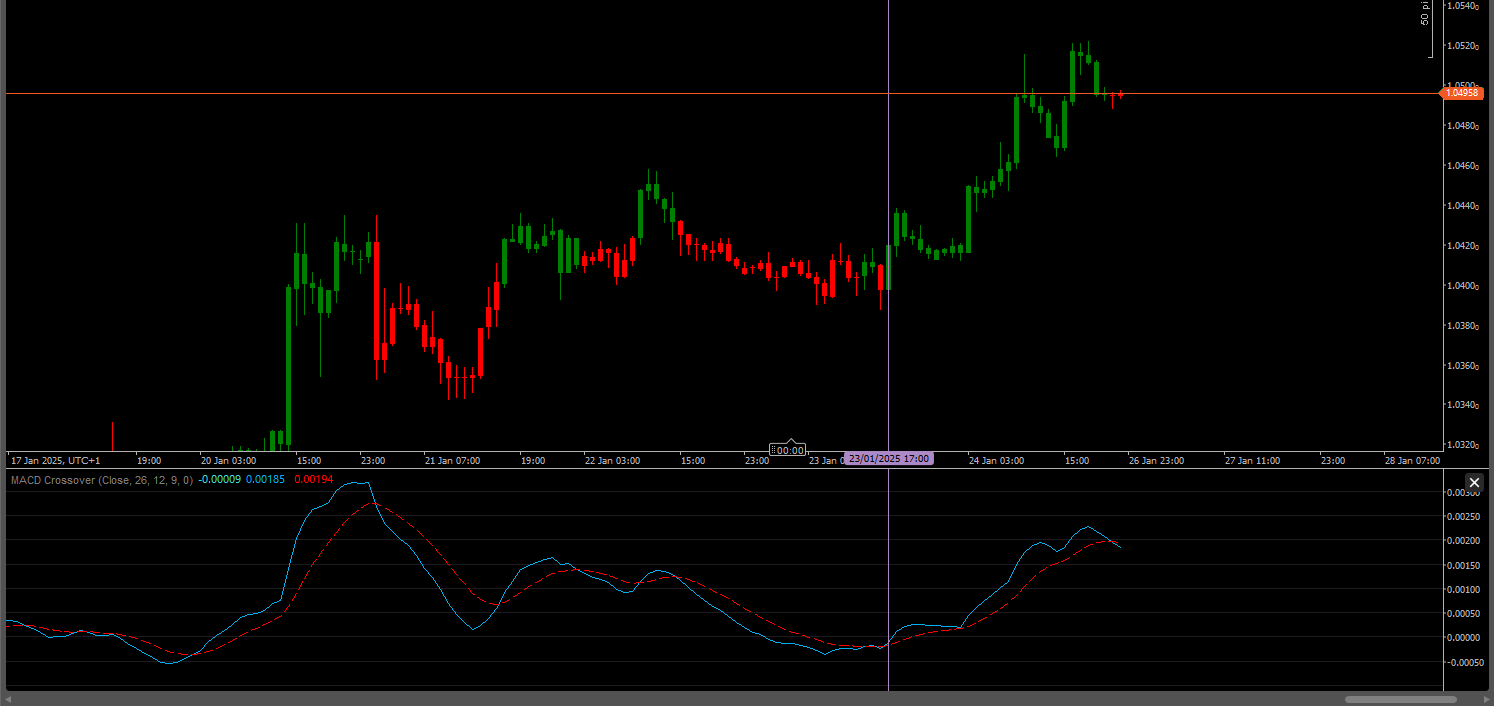
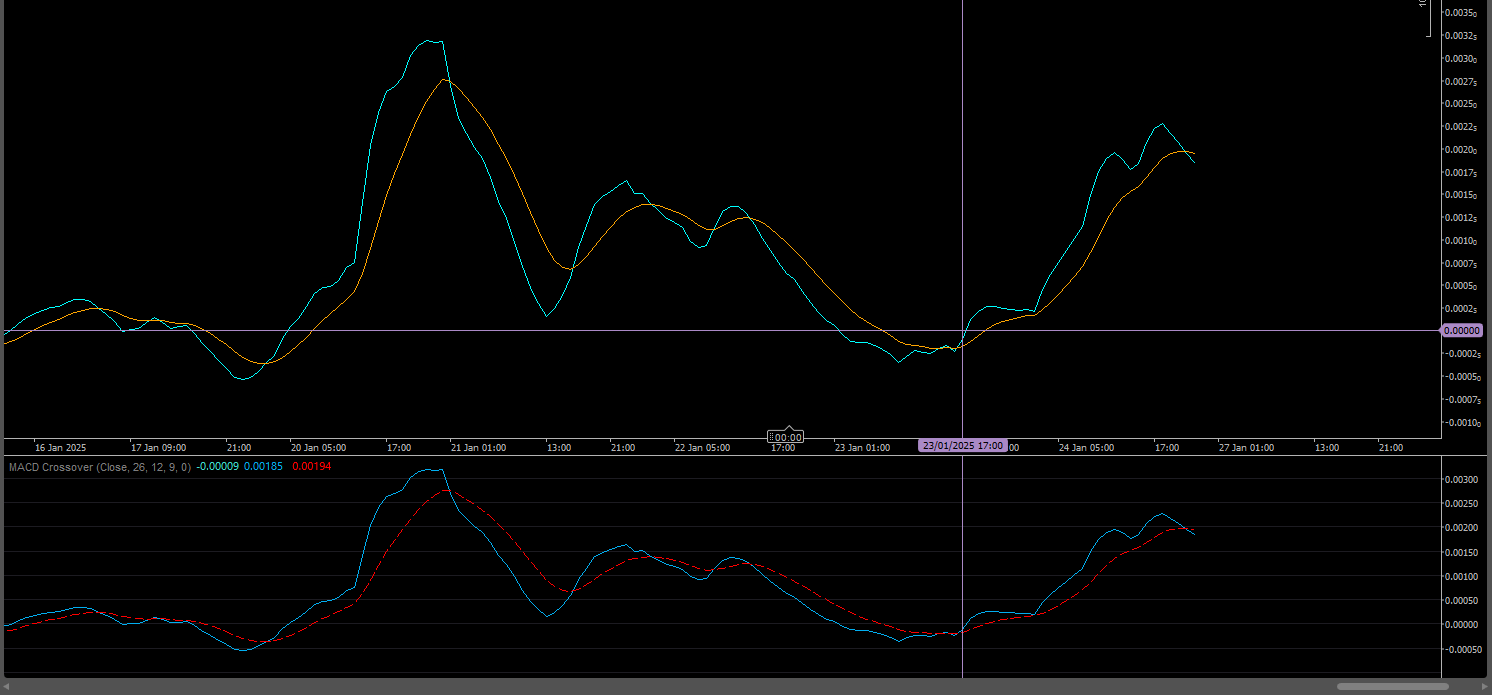
This code colors the candles based on the cross between macd and signal and then draws the macd and signal on the chart.
The problem is that the MacdLine and the SignalLine are not shown above the graph but rather straddling the 0 line and therefore below it becoming unusable.
Can anyone help me fix it?
A thousand thanks.
using System;
using cAlgo.API;
using cAlgo.API.Collections;
using cAlgo.API.Indicators;
using cAlgo.API.Internals;
namespace cAlgo
{
[Indicator(IsOverlay = true, TimeZone = TimeZones.UTC, AccessRights = AccessRights.None)]
public class MyMACD : Indicator
{
private ExponentialMovingAverage _fastEma;
private ExponentialMovingAverage _slowEma;
private ExponentialMovingAverage _signalEma;
private MacdCrossOver _macd;
[Parameter("Source", DefaultValue = "Close")]
public DataSeries Source { get; set; }
[Parameter("Fast EMA Periods", DefaultValue = 12)]
public int FastEMAPeriods { get; set; }
[Parameter("Slow EMA Periods", DefaultValue = 26)]
public int SlowEMAPeriods { get; set; }
[Parameter("Signal Periods", DefaultValue = 9)]
public int SignalPeriods { get; set; }
[Parameter("Bullish Candle Color", DefaultValue = "Green")]
public string BullishColor { get; set; }
[Parameter("Bearish Candle Color", DefaultValue = "Red")]
public string BearishColor { get; set; }
[Output("MACD Line", LineColor = "Aqua")]
public IndicatorDataSeries MacdLine { get; set; }
[Output("Signal Line", LineColor = "Orange")]
public IndicatorDataSeries SignalLine { get; set; }
protected override void Initialize()
{
_macd = Indicators.MacdCrossOver(FastEMAPeriods, SlowEMAPeriods, SignalPeriods);
_fastEma = Indicators.ExponentialMovingAverage(Source, FastEMAPeriods);
_slowEma = Indicators.ExponentialMovingAverage(Source, SlowEMAPeriods);
_signalEma = Indicators.ExponentialMovingAverage(MacdLine, SignalPeriods);
}
public override void Calculate(int index)
{
if (_macd.Signal[index] > _macd.MACD[index])
{
Chart.SetBarColor(index, Color.FromName(BullishColor));
}
else if (_macd.Signal[index] < _macd.MACD[index])
{
Chart.SetBarColor(index, Color.FromName(BearishColor));
}
MacdLine[index] = _fastEma.Result[index] - _slowEma.Result[index];
SignalLine[index] = _signalEma.Result[index];
}
}
}
firemyst
24 Feb 2025, 01:58
That's the way the MACD works. the Zero-line is the longer MA of the two MA's the MACD is monitoring. When it crosses the zero line, it means it's the faster ma is crossing the slower ma either up or down.
Two options:
@firemyst