R&S indicator
18 Oct 2018, 08:05
Dear Panagiotis!
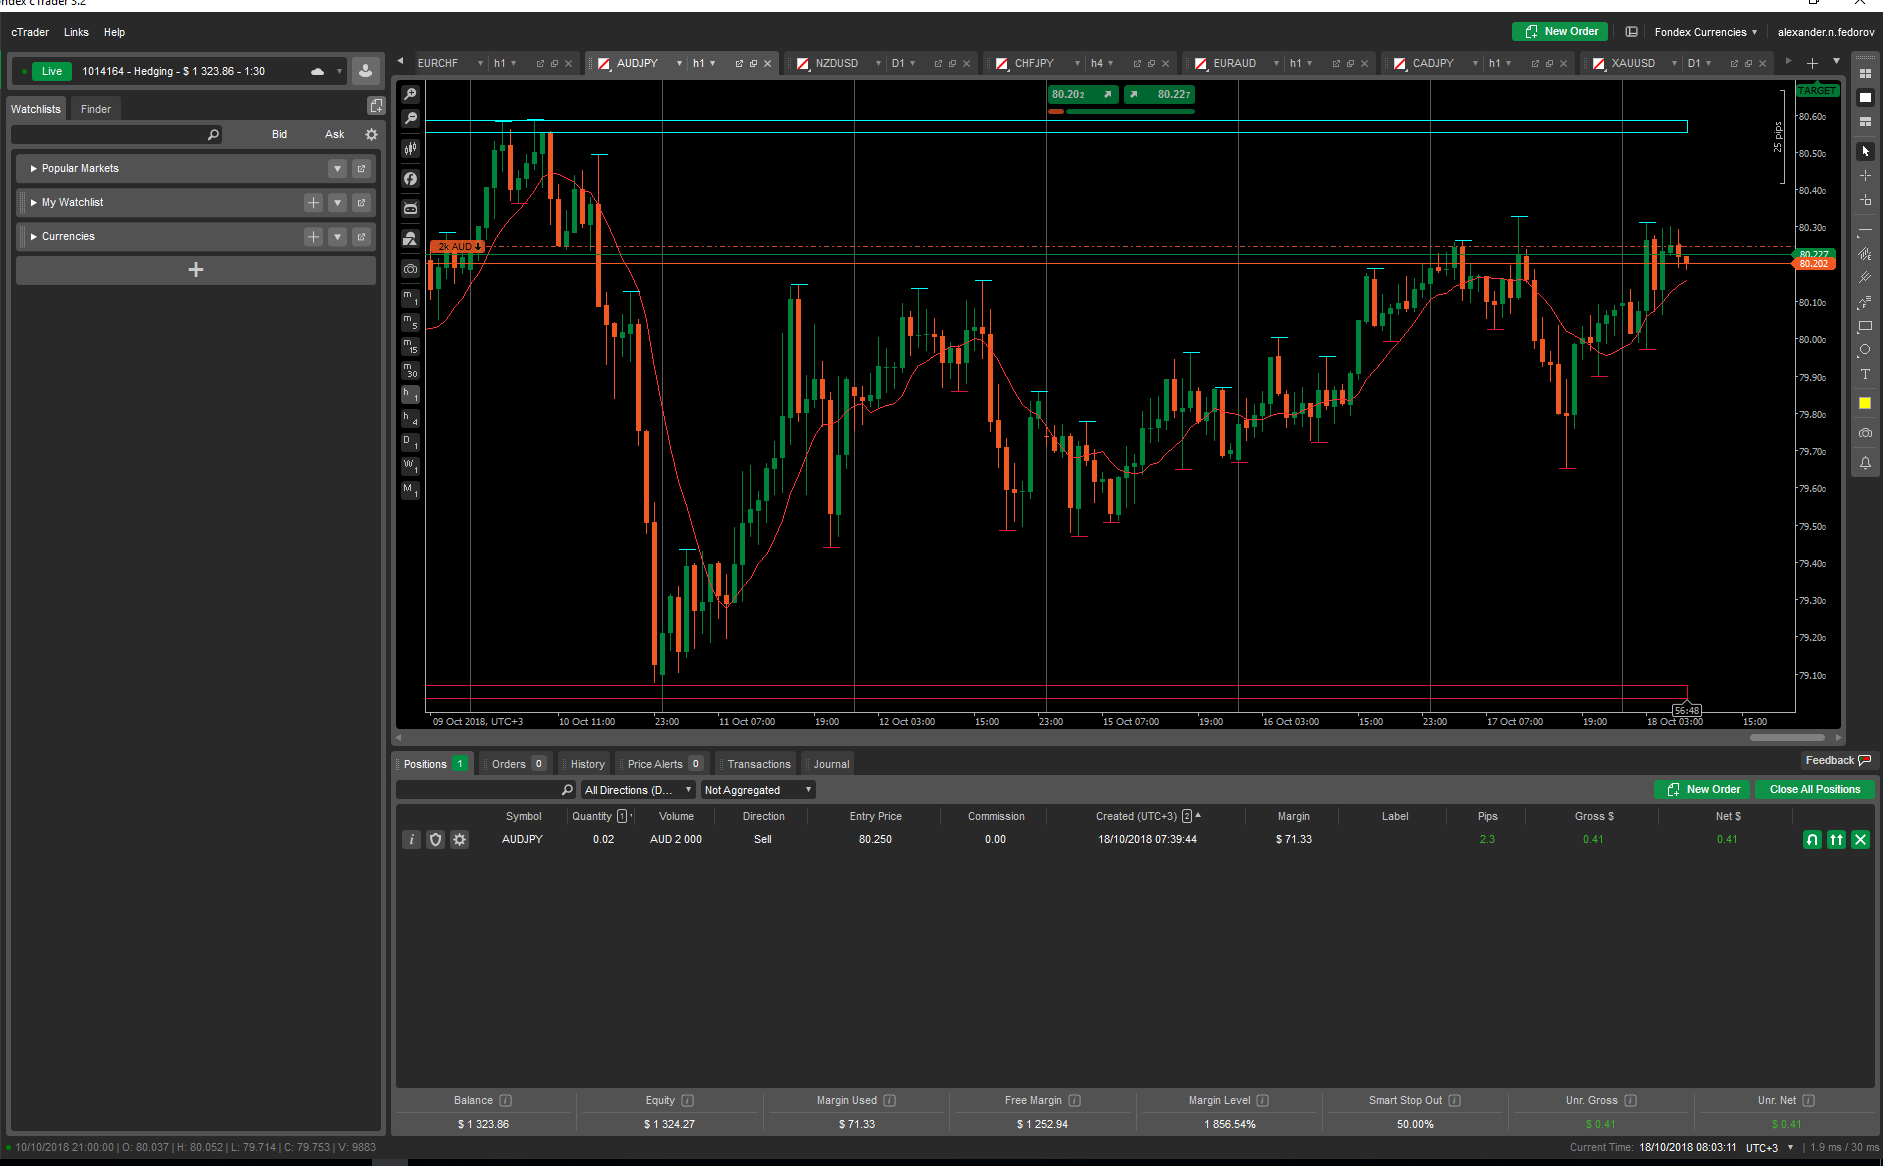
With this indicator I was trying to odtain the most important S&R lines withing the given number of bars.
I managed to obtain the highest and the lovest zones, as well as the fractals
But horisontal line it would not draw
here is the code:
using System;
using System.Linq;
using cAlgo.API;
using cAlgo.API.Indicators;
using cAlgo.API.Internals;
using cAlgo.Indicators;
using System.Collections.Generic;
namespace cAlgo.Indicators
{
[Indicator(IsOverlay = true, TimeZone = TimeZones.RussianStandardTime, AccessRights = AccessRights.FullAccess)]
public class NewPattern2 : Indicator
{
[Parameter("Source")]
public DataSeries Source { get; set; }
[Parameter("Look Back Days", DefaultValue = 100)]
public int LookBackDays { get; set; }
[Parameter("Average Zone width %", DefaultValue = 0.7)]
public double ZoneWidth { get; set; }
[Output("Main")]
public IndicatorDataSeries Result { get; set; }
private int zoneDivider;
private string instance;
private DateTime date1, today;
private int barsTotalOnChart, bar1, bar2;
private double lowerHigh, higherLow;
private List<double> price = new List<double>();
//private List<int> counters = new List<int>();
protected override void Initialize()
{
instance = ToString() + ", " + Symbol.Code + ", " + TimeFrame + ", " + Account.BrokerName + ", " + Account.Number;
date1 = MarketSeries.OpenTime.LastValue.AddDays(-LookBackDays);
today = MarketSeries.OpenTime.LastValue;
barsTotalOnChart = Chart.BarsTotal;
bar1 = barsTotalOnChart - LookBackDays;
bar2 = barsTotalOnChart;
if (TimeFrame == TimeFrame.Daily)
{
zoneDivider = 1;
}
if (TimeFrame == TimeFrame.Hour4)
{
zoneDivider = 6;
}
if (TimeFrame == TimeFrame.Hour)
{
zoneDivider = 24;
}
if (TimeFrame == TimeFrame.Minute30)
{
zoneDivider = 48;
}
if (TimeFrame == TimeFrame.Minute15)
{
zoneDivider = 96;
}
if (TimeFrame == TimeFrame.Minute5)
{
zoneDivider = 288;
}
}
public override void Calculate(int index)
{
double high = MarketSeries.High.LastValue;
double low = MarketSeries.Low.LastValue;
for (int i = 0; i < LookBackDays; i++)
{
high = high > MarketSeries.High.Last(i) ? high : MarketSeries.High.Last(i);
low = low < MarketSeries.Low.Last(i) ? low : MarketSeries.Low.Last(i);
}
lowerHigh = high * (1 - ZoneWidth / zoneDivider / 100);
higherLow = low * (1 + ZoneWidth / zoneDivider / 100);
Chart.DrawRectangle("upper Zone", bar1, high, bar2, lowerHigh, Color.Aqua);
Chart.DrawRectangle("lower Zone", bar1, low, bar2, higherLow, Color.Crimson);
// Chart.RemoveAllObjects();
for (int i = 2; i < LookBackDays; i++)
{
if (MarketSeries.High.Last(i) > MarketSeries.High.Last(i - 1) && MarketSeries.High.Last(i) > MarketSeries.High.Last(i - 2) && MarketSeries.High.Last(i) > MarketSeries.High.Last(i - 3) && MarketSeries.High.Last(i) > MarketSeries.High.Last(i + 1) && MarketSeries.High.Last(i) > MarketSeries.High.Last(i + 2))
{
price.Add(i);
Chart.DrawTrendLine("ChartB" + i.ToString(), MarketSeries.OpenTime.Last(i - 1), MarketSeries.High.Last(i) + Symbol.PipSize / zoneDivider * 5, MarketSeries.OpenTime.Last(i + 1), MarketSeries.High.Last(i) + Symbol.PipSize / zoneDivider * 5, Color.Aqua);
}
if (MarketSeries.Low.Last(i) < MarketSeries.Low.Last(i - 1) && MarketSeries.Low.Last(i) < MarketSeries.Low.Last(i - 2) && MarketSeries.Low.Last(i) < MarketSeries.Low.Last(i - 3) && MarketSeries.Low.Last(i) < MarketSeries.Low.Last(i + 1) && MarketSeries.Low.Last(i) < MarketSeries.Low.Last(i + 2))
{
price.Add(i);
Chart.DrawTrendLine("ChartE" + i.ToString(), MarketSeries.OpenTime.Last(i - 1), MarketSeries.Low.Last(i) - Symbol.PipSize / zoneDivider * 5, MarketSeries.OpenTime.Last(i + 1), MarketSeries.Low.Last(i) - Symbol.PipSize / zoneDivider * 5, Color.Crimson);
}
}
var distance = ZoneWidth / zoneDivider / 50 ;
var counter = 1;
for (int k = 0; k < price.Count(); k++)
{
var rsPrice = price[k];
for (int i = 1; i <= price.Count(); i++)
{
if (price[k] >= price[i] - distance && price[k] <= price[i] + distance)
{
counter = counter + 1;
rsPrice = rsPrice + price[i];
}
}
if (counter > 2)
{
rsPrice = rsPrice / counter;
Chart.DrawHorizontalLine(k.ToString(), rsPrice, Color.Goldenrod,1,LineStyle.DotsVeryRare);
}
}
}
}
}

Replies
PanagiotisCharalampous
18 Oct 2018, 15:08
Hi Sasha,
From the information provided it is not easy to me to understand what you are trying to do. Can you draw on the chart what would you expect to see and which lines of code do you expect to do that?
Best Regards,
Panagiotis
@PanagiotisCharalampous
alexander.n.fedorov
18 Oct 2018, 16:05
Considering my English, it is a bit difficult to explain
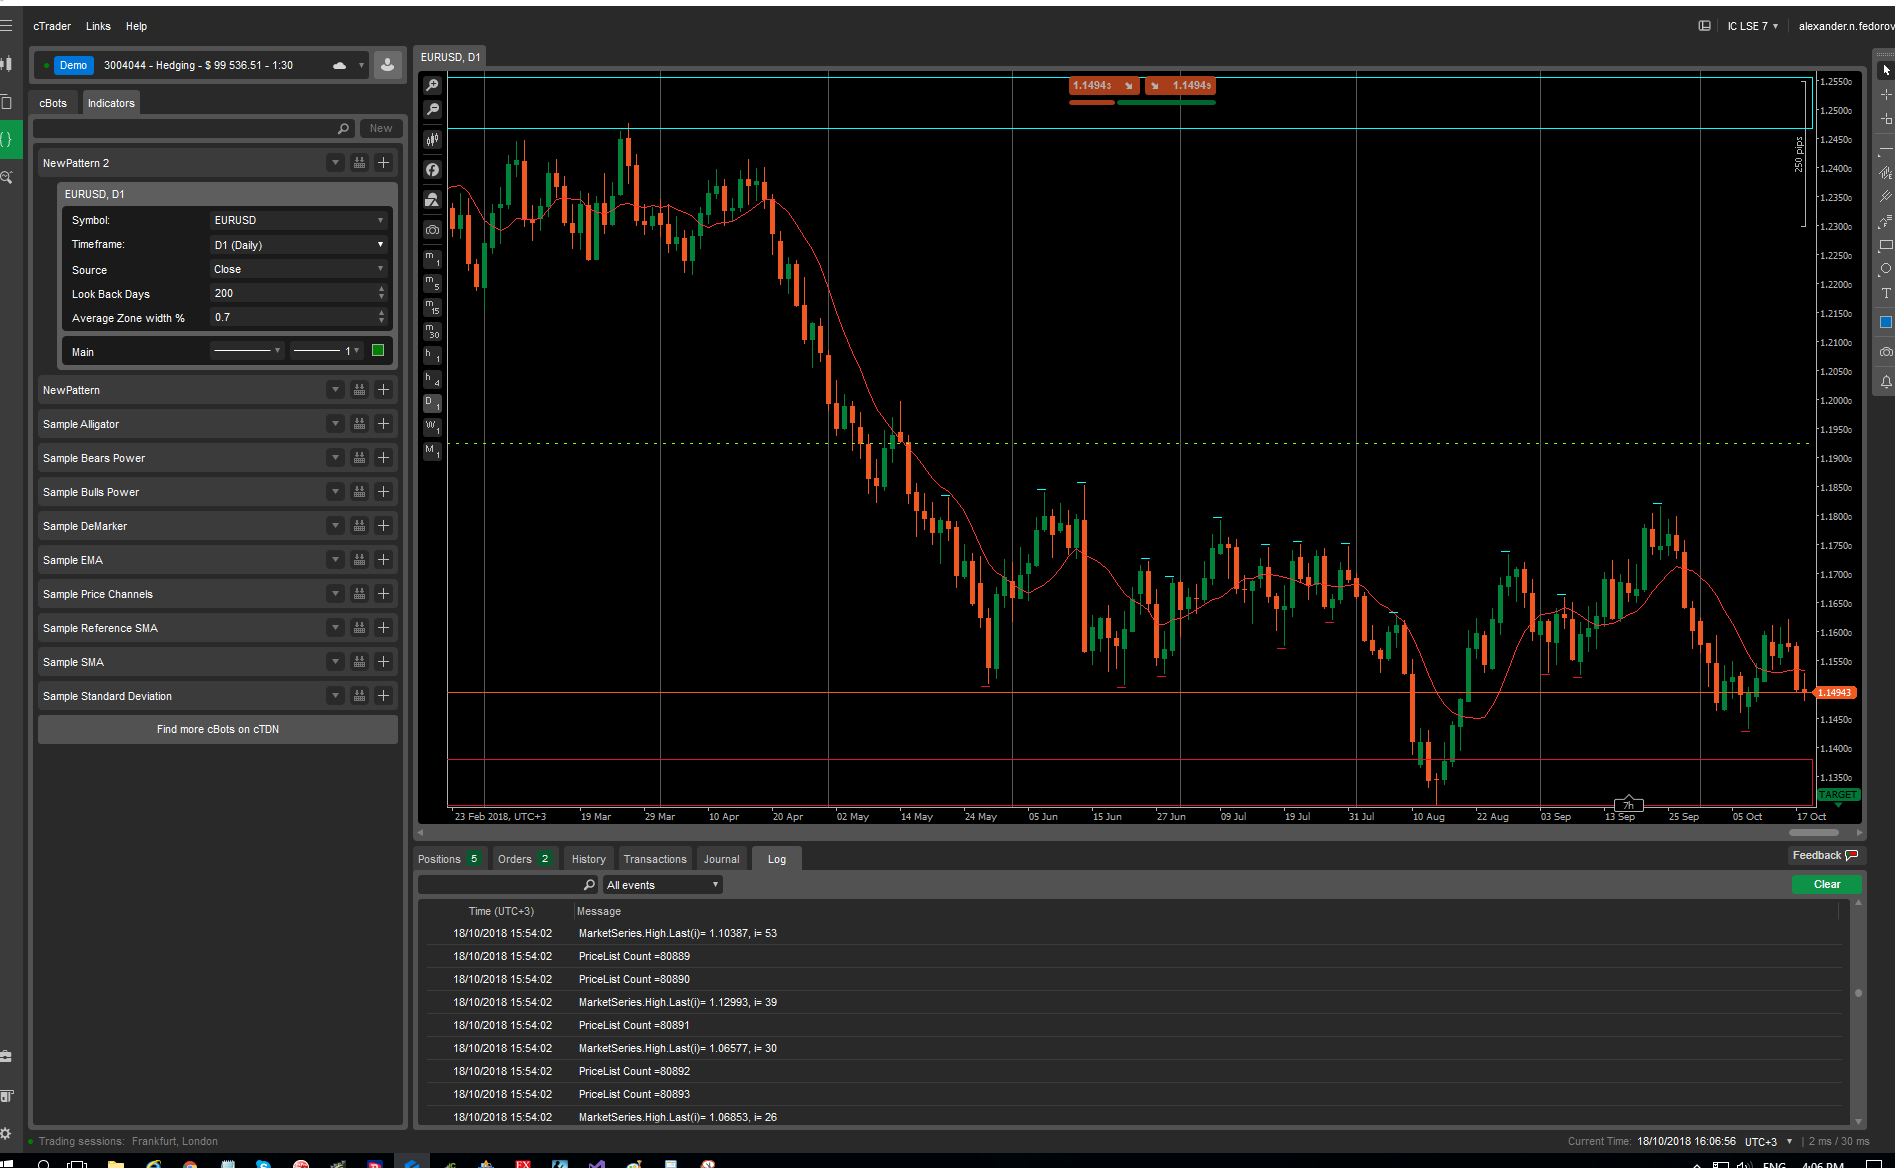
on the chart you see the upper rectangle (supply zone?) and the lower rectangle (demand zone?), i may be confusing them
It is a daily chart
in between of them you see MarketSeries
If the Market Series represent a fractal it is marked
I am trying to draw the lines which will have the most of the fractals concentration around then. By drawing them I think I must have an idea about Support and Resistance
Regards.
P.S. The codes I tried different. they all do not make sense
@alexander.n.fedorov
alexander.n.fedorov
18 Oct 2018, 16:10
( Updated at: 21 Dec 2023, 09:20 )
That is the latest piece of code
public override void Calculate(int indexi)
{
double high = MarketSeries.High.LastValue;
double low = MarketSeries.Low.LastValue;
for (int i = 0; i < LookBackDays; i++)
{
high = high > MarketSeries.High.Last(i) ? high : MarketSeries.High.Last(i);
low = low < MarketSeries.Low.Last(i) ? low : MarketSeries.Low.Last(i);
}
lowerHigh = high * (1 - ZoneWidth / zoneDivider / 100);
higherLow = low * (1 + ZoneWidth / zoneDivider / 100);
Chart.DrawRectangle("upper Zone", bar1, high, bar2, lowerHigh, Color.Aqua);
Chart.DrawRectangle("lower Zone", bar1, low, bar2, higherLow, Color.Crimson);
// Chart.RemoveAllObjects();
for (int i = 100; i >3 ; i--)
{
if (MarketSeries.High.Last(i) > MarketSeries.High.Last(i - 1) && MarketSeries.High.Last(i) > MarketSeries.High.Last(i - 2) && MarketSeries.High.Last(i) > MarketSeries.High.Last(i - 3) && MarketSeries.High.Last(i) > MarketSeries.High.Last(i + 1) && MarketSeries.High.Last(i) > MarketSeries.High.Last(i + 2))
{
Print("MarketSeries.High.Last(i)= {0}, i= {1}", MarketSeries.High.Last(i), i);
priceList.Add(MarketSeries.High.Last(i));
Print("PriceList Count ={0}", priceList.Count);
Chart.DrawTrendLine("ChartB" + i.ToString(), MarketSeries.OpenTime.Last(i+1 ), MarketSeries.High.Last(i) + Symbol.PipSize / zoneDivider * 5, MarketSeries.OpenTime.Last(i ), MarketSeries.High.Last(i) + Symbol.PipSize / zoneDivider * 5, Color.Aqua);
}
if (MarketSeries.Low.Last(i) < MarketSeries.Low.Last(i - 1) && MarketSeries.Low.Last(i) < MarketSeries.Low.Last(i - 2) && MarketSeries.Low.Last(i) < MarketSeries.Low.Last(i - 3) && MarketSeries.Low.Last(i) < MarketSeries.Low.Last(i + 1) && MarketSeries.Low.Last(i) < MarketSeries.Low.Last(i + 2))
{
priceList.Add(MarketSeries.Low.Last(i));
Print("PriceList Count ={0}", priceList.Count);
Chart.DrawTrendLine("ChartE" + i.ToString(), MarketSeries.OpenTime.Last(i+1 ), MarketSeries.Low.Last(i) - Symbol.PipSize / zoneDivider * 5, MarketSeries.OpenTime.Last(i ), MarketSeries.Low.Last(i) - Symbol.PipSize / zoneDivider * 5, Color.Crimson);
}
}
var midZone = (lowerHigh + higherLow) / 2;
Chart.DrawHorizontalLine("mid", midZone, Color.Chartreuse, 1, LineStyle.DotsVeryRare);
//Print("PriceList Count ={0}", priceList.Count);
//for (int k = 0; k < priceList.Count; k++)
//{
// if (priceList[k] <= midZone)
// {
// priceLower.Add(priceList[k]);
// }
//}
//var midline = priceLower.Count >0 ? priceLower.Average():0.0;
//Chart.DrawHorizontalLine("mid2", midline, Color.Cyan, 1, LineStyle.DotsVeryRare);
//Print(midline);
}
}
}
The latest screenshot
Regards,
Alexander
@alexander.n.fedorov

alexander.n.fedorov
18 Oct 2018, 08:06
as you can see, the upper and lower bands are working perfectly, but the horizontal lines just would not draw. Can you explain?
Regards,
Sasha
@alexander.n.fedorov