Description
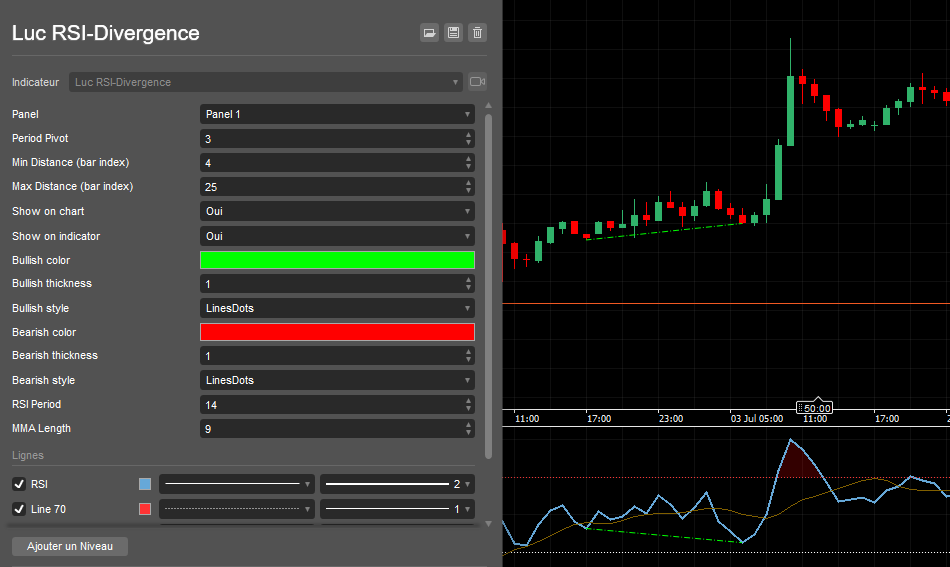
This indicator displays the RSI with colors for levels above 70 and below 30. It also displays a divergence on the graph and indicator sections.

using System;
using cAlgo.API;
using cAlgo.API.Collections;
using cAlgo.API.Indicators;
using cAlgo.API.Internals;

namespace cAlgo
{
    [Cloud ( "RSI", "Line 70", Opacity = 0.2 , FirstColor = "RED", SecondColor = "TRANSPARENT")]
    [Cloud ( "RSI", "Line 30", Opacity = 0.2 , FirstColor = "TRANSPARENT", SecondColor = "GREEN")]
    [Indicator(IsOverlay = false, TimeZone = TimeZones.UTC, AccessRights = AccessRights.None)]
    public class LucRSIDivergence : Indicator
    {
        [Parameter("Period Pivot", DefaultValue = 3, MinValue = 1)]
        public int Period { get; set; }
        [Parameter("Min Distance (bar index)", DefaultValue = 4, MinValue = 1)]
        public int minDistance { get; set; }
        [Parameter("Max Distance (bar index)", DefaultValue = 25, MinValue = 1)]
        public int maxDistance { get; set; }
        [Parameter("Show on chart", DefaultValue = true)]
        public bool showOnChart { get; set; }
        [Parameter("Show on indicator", DefaultValue = true)]
        public bool showOnIndicator { get; set; }
        [Parameter("Bullish color", DefaultValue = "Lime")]
        public Color bullishColor { get; set; }
        [Parameter("Bullish thickness", DefaultValue = 1)]
        public int bullishThickness { get; set; }
        [Parameter("Bullish style", DefaultValue = LineStyle.LinesDots)]
        public LineStyle bullishStyle { get; set; }
        [Parameter("Bearish color", DefaultValue = "Red")]
        public Color bearishColor { get; set; }
        [Parameter("Bearish thickness", DefaultValue = 1)]
        public int bearishThickness { get; set; }
        [Parameter("Bearish style", DefaultValue = LineStyle.LinesDots)]
        public LineStyle bearishStyle { get; set; }
        [Parameter("RSI Period", DefaultValue = 14, MinValue = 1)]
        public int rsiPeriod { get; set; }
        [Parameter("MMA Length", DefaultValue = 9, MinValue = 1)]
        public int mma_period { get; set; }

        //[Output("Pivot High", PlotType = PlotType.Points, Thickness = 7, LineColor = "Yellow")]
        //public IndicatorDataSeries pivotH { get; set; }
        //[Output("Pivot Low", PlotType = PlotType.Points, Thickness = 7, LineColor = "Lime")]
        //public IndicatorDataSeries pivotL { get; set; }

        [Output("RSI", LineColor = "#FF66A8D8", Thickness = 2)]
        public IndicatorDataSeries rsi { get; set; }
        [Output("Line 70", LineColor = "#FFFF3334", LineStyle = LineStyle.Dots)]
        public IndicatorDataSeries l70 { get; set; }
        [Output("Line 50", LineColor = "#FFFFFFFF", LineStyle = LineStyle.Dots)]
        public IndicatorDataSeries l50 { get; set; }
        [Output("Line 30", LineColor = "#FF00BF00", LineStyle = LineStyle.Dots)]
        public IndicatorDataSeries l30 { get; set; }
        [Output("Moving Average", LineColor = "#FF805F00")]
        public IndicatorDataSeries rsi_mma { get; set; }

        private IndicatorDataSeries pivotH, pivotL;
        private SimpleMovingAverage mma;

        private RelativeStrengthIndex _rsi;
        protected override void Initialize()
        {
            _rsi = Indicators.RelativeStrengthIndex(Bars.ClosePrices, rsiPeriod);
            mma = Indicators.SimpleMovingAverage(_rsi.Result, mma_period);

            pivotH = CreateDataSeries();
            pivotL = CreateDataSeries();
        }

        private int lastIndex=-1;
        public override void Calculate(int index)
        {
            double PivotHigh = double.NaN;
            double PivotLow = double.NaN;

            rsi[index] = _rsi.Result[index];
            l70[index] = 70;
            l50[index] = 50;
            l30[index] = 30;
            rsi_mma[index] = mma.Result[index];

            if (lastIndex == index) return;
            lastIndex = index;
            index -= 1;

            var pivot_index = index - Period;
            if (pivot_index < Period) return;

            var isHighPivot = true;
            var isLowPivot = true;
            for (var i = pivot_index - Period; i <= pivot_index + Period; i++)
            {
                if (i != pivot_index)
                {
                    if (_rsi.Result[i] >= _rsi.Result[pivot_index])
                    {
                        isHighPivot = false;
                    }
                    if (_rsi.Result[i] <= _rsi.Result[pivot_index])
                    {
                        isLowPivot = false;
                    }
                }
            }

            PivotHigh = isHighPivot ? _rsi.Result[pivot_index] : double.NaN;
            PivotLow = isLowPivot ? _rsi.Result[pivot_index] : double.NaN;

            // Determine pivot point types
            if (!double.IsNaN(PivotHigh))
            {
                pivotH[pivot_index] = PivotHigh;

                if (showOnChart || showOnIndicator)
                {
                    bool traverse = false;
                    int idx=-1;
                    double highBarPivot = Math.Max(Math.Max(Bars[pivot_index].High,Bars[pivot_index+1].High),Bars[pivot_index-1].High);
                    for (int i=pivot_index-minDistance; i>=0 && i>=pivot_index-maxDistance; i--)
                    {
                        if (double.IsNaN(pivotH[i])) continue;

                        double highBar = Math.Max(Math.Max(Bars[i].High,Bars[i+1].High),Bars[i-1].High);

                        // regular
                        if (pivotH[pivot_index]<pivotH[i] && highBarPivot>highBar)
                        {
                            var dx = i - pivot_index;
                            var m = (pivotH[i] - pivotH[pivot_index]) / dx;
                            var b = pivotH[i] - m * i;

                            for (int j = i+1; j<pivot_index-minDistance; j++)
                            {

                                if (m*j+b<=rsi[j])
                                {
                                    traverse = true;
                                    break;
                                }
                            }
                            if (traverse) break;
                            idx = i;
                            break;
                        }
                        // hidden
                        if (pivotH[pivot_index]>pivotH[i] && highBarPivot<highBar)
                        {
                            var dx = i - pivot_index;
                            var m = (pivotH[i] - pivotH[pivot_index]) / dx;
                            var b = pivotH[i] - m * i;


                            for (int j = i+1; j<pivot_index-minDistance; j++)
                            {
                                if (m*j+b<=rsi[j])
                                {
                                    traverse = true;
                                    break;
                                }
                            }
                            if (traverse) break;
                            idx = i;
                            break;
                        }
                    }

                    if (idx != -1 && showOnIndicator)
                        IndicatorArea.DrawTrendLine("down_"+idx+""+pivot_index, idx, pivotH[idx], pivot_index, pivotH[pivot_index], bearishColor, bearishThickness, bearishStyle);
                    if (idx != -1 && showOnChart)
                        Chart.DrawTrendLine("downC_"+idx+""+pivot_index, idx, Bars[idx].High, pivot_index, Bars[pivot_index].High, bearishColor, bearishThickness, bearishStyle);
                }
            }
            if (!double.IsNaN(PivotLow))
            {
                pivotL[pivot_index] = PivotLow;

                if (showOnChart || showOnIndicator)
                {
                    bool traverse = false;
                    int idx=-1;
                    double lowBarPivot = Math.Min(Math.Min(Bars[pivot_index].Low,Bars[pivot_index+1].Low),Bars[pivot_index-1].Low);
                    for (int i=pivot_index-minDistance; i>=0 && i>=pivot_index-maxDistance; i--)
                    {
                        if (double.IsNaN(pivotL[i])) continue;

                        double lowBar = Math.Min(Math.Min(Bars[i].Low,Bars[i+1].Low),Bars[i-1].Low);

                        // regular
                        if (pivotL[pivot_index]>pivotL[i] && lowBarPivot<lowBar)
                        {
                            var dx = i - pivot_index;
                            var m = (pivotL[i] - pivotL[pivot_index]) / dx;
                            var b = pivotL[i] - m * i;

                            for (int j = i+1; j<pivot_index-minDistance; j++)
                            {

                                if (m*j+b>=rsi[j])
                                {
                                    traverse = true;
                                    break;
                                }
                            }
                            if (traverse) break;
                            idx = i;
                            break;
                        }
                        // hidden
                        if (pivotL[pivot_index]<pivotL[i] && lowBarPivot>lowBar)
                        {
                            var dx = i - pivot_index;
                            var m = (pivotL[i] - pivotL[pivot_index]) / dx;
                            var b = pivotL[i] - m * i;


                            for (int j = i+1; j<pivot_index-minDistance; j++)
                            {
                                if (m*j+b>=rsi[j])
                                {
                                    traverse = true;
                                    break;
                                }
                            }
                            if (traverse) break;
                            idx = i;
                            break;
                        }
                    }

                    if (idx != -1 && showOnIndicator)
                        IndicatorArea.DrawTrendLine("up_"+idx+""+pivot_index, idx, pivotL[idx], pivot_index, pivotL[pivot_index], bullishColor, bullishThickness, bullishStyle);
                    if (idx != -1 && showOnChart)
                        Chart.DrawTrendLine("up2_"+idx+""+pivot_index, idx, Bars[idx].Low, pivot_index, Bars[pivot_index].Low, bullishColor, bullishThickness, bullishStyle);
                }
            }
        }

    }
}
LB
lbellego
Joined on 20.06.2024
- Distribution: Free
- Language: C#
- Trading platform: cTrader Automate
- File name: Luc RSI-Divergence_withSourceCode.algo
- Rating: 5
- Installs: 674
- Modified: 22/07/2024 18:13
Note that publishing copyrighted material is strictly prohibited. If you believe there is copyrighted material in this section, please use the Copyright Infringement Notification form to submit a claim.
Comments
Log in to add a comment.

Here's exactly what cTrader needed. Great job ! Thx