Description
Bull Bear Power with selectable sources.
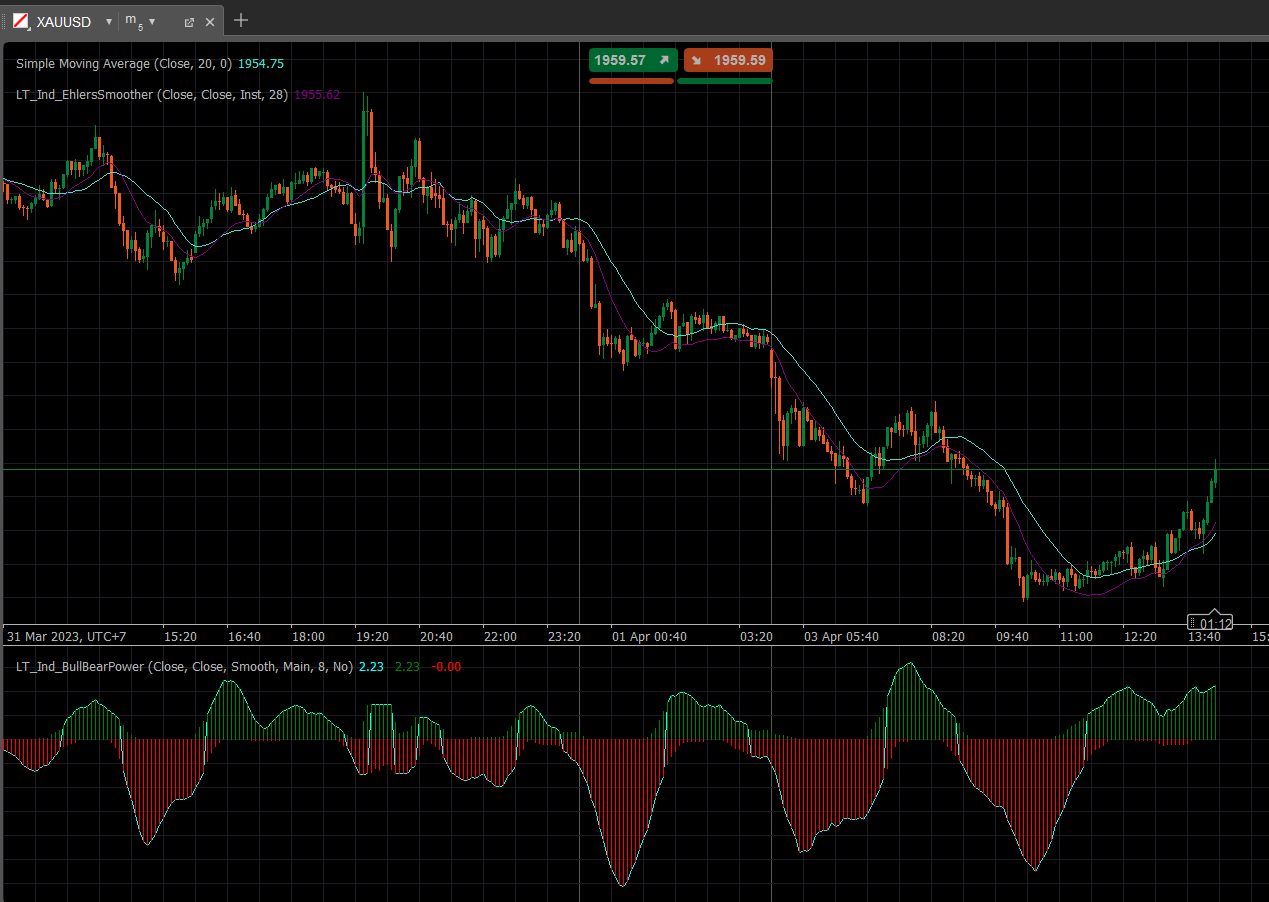
See also my Ehlers Smoother, the example here apply on the same setting mentioned there:

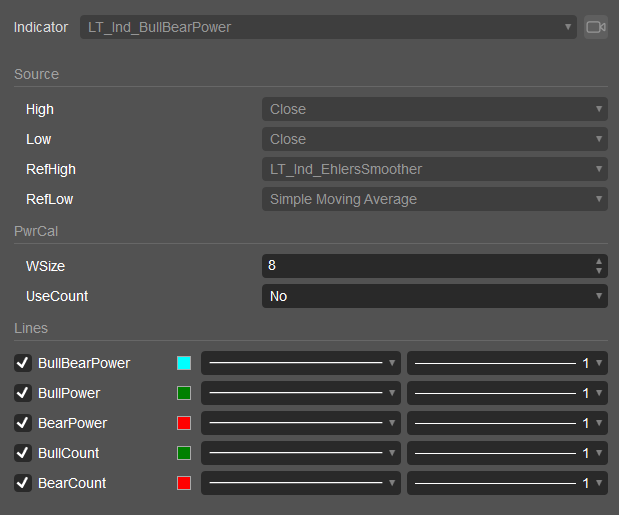
High: The High source. For price you can use High or Close, it just the sampling point.
Low: The Low source.
RefHigh: Reference High for calculating power, if use the same source with RefLow then there will be no gap switching power.
RefLow: Reference Low for calculating power.
WSize: Window Size for calculating power.
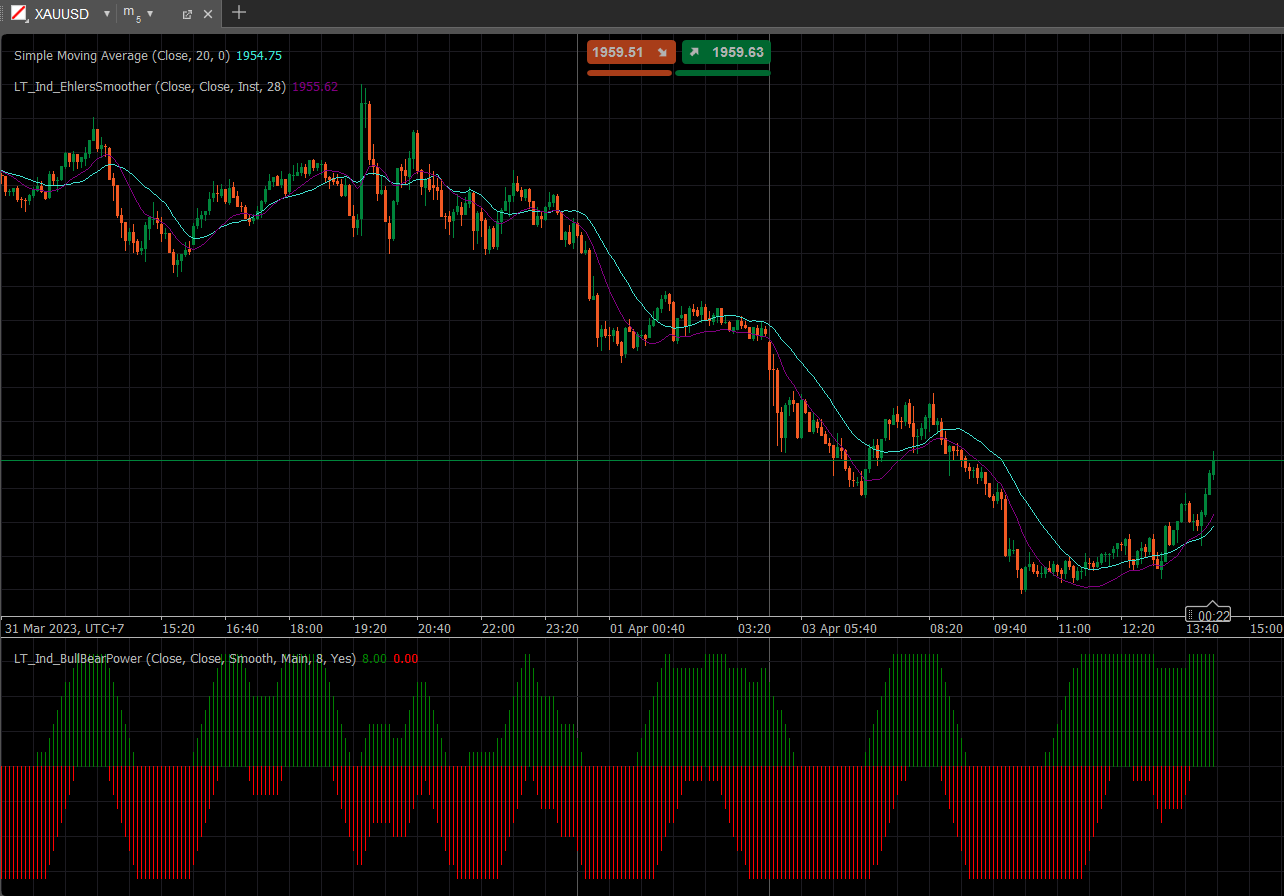
UseCount: If true, then it return the Count, not the actual Power.
Example: You want to measure the power of price against the SMA 20, choose High = High(Close), Low = Low(Close), RefHigh = SMA20, RefLow = SMA20.
Example 2: If you want some gap between Bull and Bear, use different RefHigh and RefLow, e.g. in my example, RefHigh = Instantaneous Trendline, RefLow = SMA20.

Here is the result of using Count:

using System;
using System.Collections.Generic;
using System.Linq;
using System.Text;
using cAlgo.API;
using cAlgo.API.Collections;
using cAlgo.API.Indicators;
using cAlgo.API.Internals;
using LittleTrader;
using LittleTrader.Ehlers;
using LittleTrader.Extensions;
using MoreLinq;

namespace cAlgo
{
    [Indicator(AccessRights = AccessRights.None)]
    public class LT_Ind_BullBearPower : Indicator
    {
        [Parameter(Group = "Source")]
        public DataSeries High { get; set; }

        [Parameter(Group = "Source")]
        public DataSeries Low { get; set; }

        [Parameter(Group = "Source")]
        public DataSeries RefHigh { get; set; }

        [Parameter(Group = "Source")]
        public DataSeries RefLow { get; set; }

        [Parameter(DefaultValue = 8, Group = "PwrCal")]
        public int WSize { get; set; }

        [Parameter(DefaultValue = false, Group = "PwrCal")]
        public bool UseCount { get; set; }

        [Output("BullBearPower", LineColor = "Cyan")]
        public IndicatorDataSeries BullBearPower { get; set; }

        [Output("BullPower", LineColor = "Green", PlotType = PlotType.Histogram)]
        public IndicatorDataSeries BullPower { get; set; }

        [Output("BearPower", LineColor = "Red", PlotType = PlotType.Histogram)]
        public IndicatorDataSeries BearPower { get; set; }

        [Output("BullCount", LineColor = "Green", PlotType = PlotType.Histogram)]
        public IndicatorDataSeries BullCount { get; set; }

        [Output("BearCount", LineColor = "Red", PlotType = PlotType.Histogram)]
        public IndicatorDataSeries BearCount { get; set; }

        protected override void Initialize()
        {
        }

        public override void Calculate(int index)
        {
            if (index < WSize) return;

            var bullWindow = new Windowlysis(High, index, WSize).BullBearPowerCalculate(RefHigh);
            var bearWindow = new Windowlysis(Low, index, WSize).BullBearPowerCalculate(RefLow);

            if (UseCount)
            {
                BullCount[index] = bullWindow.BullCount;
                BearCount[index] = bearWindow.BearCount;
            }
            else
            {
                BullPower[index] = bullWindow.BullPower;
                BearPower[index] = bearWindow.BearPower;

                BullBearPower[index] = BullPower[index].Dominant(BearPower[index]);

            }
        }

    }
}
dhnhuy
Joined on 03.04.2023
- Distribution: Free
- Language: C#
- Trading platform: cTrader Automate
- File name: LT_Ind_BullBearPower.algo
- Rating: 0
- Installs: 803
- Modified: 03/04/2023 07:20
