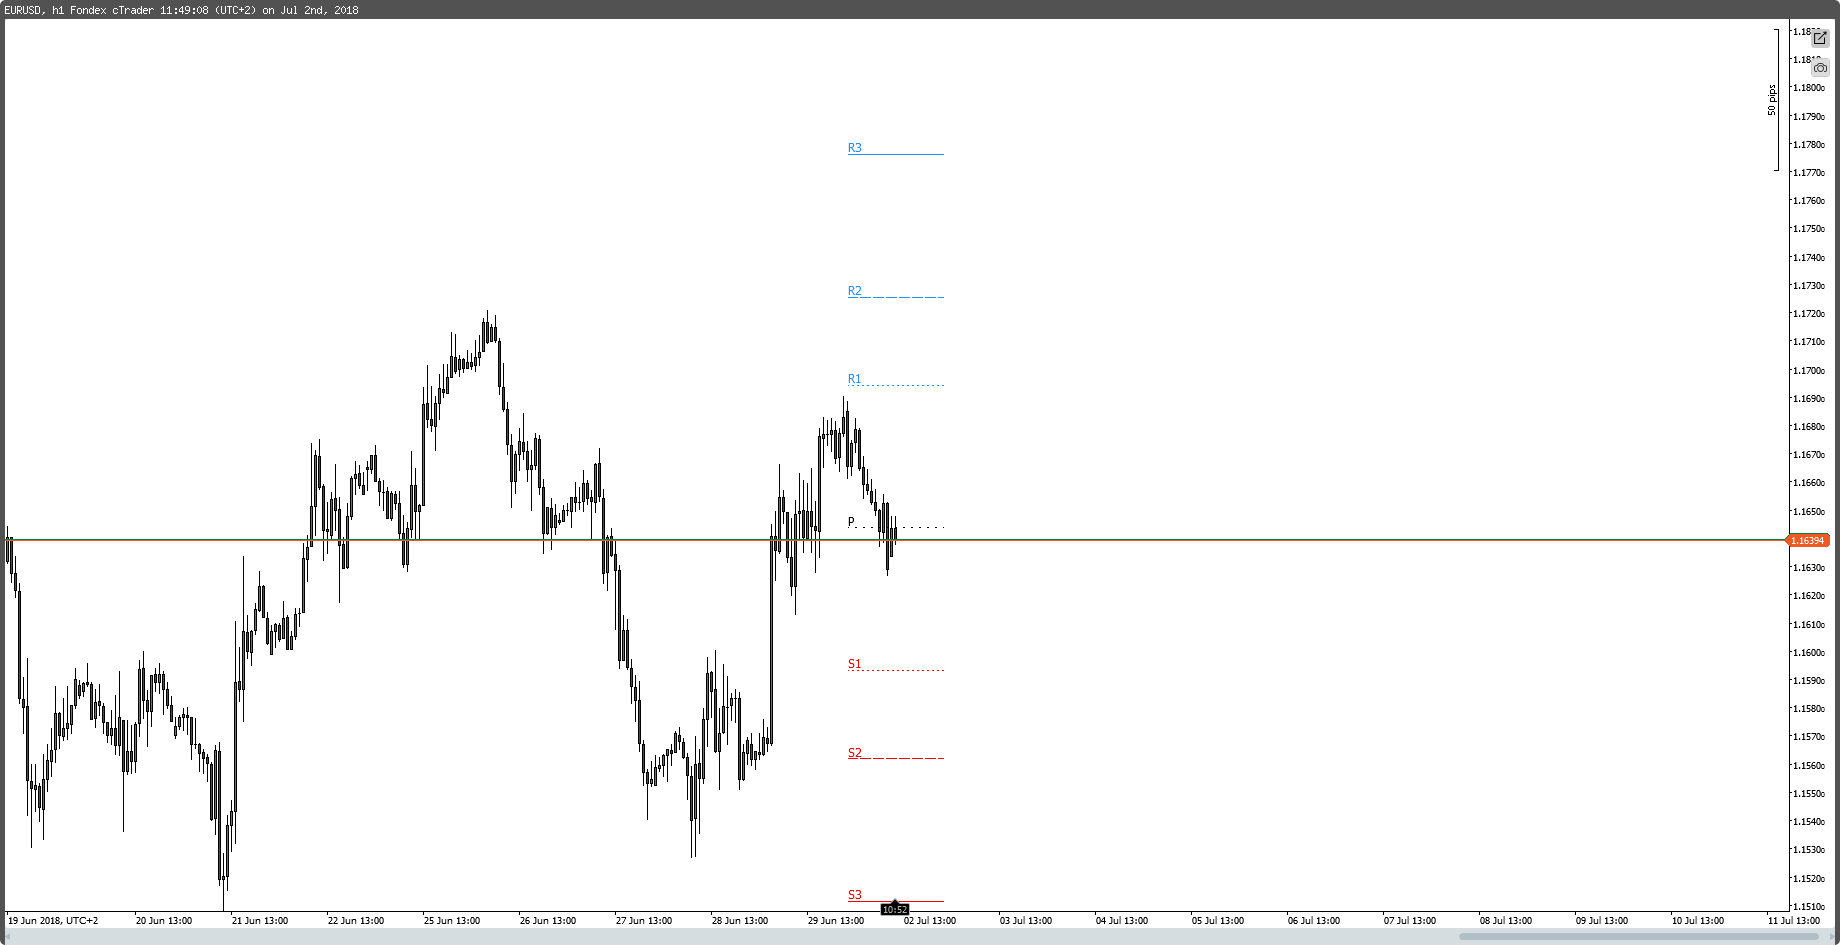
Description

Hello all,
I have corrected some indicators and cBots on this forum, this is the enhanced version of the Fibonacci Pivot Points, you can set different options among which the Fibonacci levels to be displayed and for only one day or all days.
Good luck.
/*

    You can find these and other indicators / cbots on my website ( Italian language but indicators / cBots in English )
    https://sinfoniamt4.altervista.org/downloads/

*/

using System;
using cAlgo.API;
using cAlgo.API.Internals;
using cAlgo.API.Indicators;

namespace cAlgo.Indicators
{
    [Indicator(IsOverlay = true, TimeZone = TimeZones.EasternStandardTime, AccessRights = AccessRights.None)]
    public class FiboPivotPoints : Indicator
    {
        private DateTime _previousPeriodStartTime;
        private int _previousPeriodStartIndex;
        private TimeFrame PivotTimeFrame;
        private VerticalAlignment vAlignment = VerticalAlignment.Top;
        private HorizontalAlignment hAlignment = HorizontalAlignment.Right;

        Colors pivotColor = Colors.Black;
        Colors supportColor = Colors.Red;
        Colors resistanceColor = Colors.DodgerBlue;

        [Parameter("Fibo 1°", DefaultValue = 0.382)]
        public double Fibo1 { get; set; }

        [Parameter("Fibo 2°", DefaultValue = 0.618)]
        public double Fibo2 { get; set; }

        [Parameter("Fibo 3°", DefaultValue = 1.0)]
        public double Fibo3 { get; set; }


        [Parameter("Only Last Day ?", DefaultValue = true)]
        public bool OnlyLastDay { get; set; }

        [Parameter("Show Labels", DefaultValue = true)]
        public bool ShowLabels { get; set; }

        [Parameter("Pivot Color", DefaultValue = "Black")]
        public string PivotColor { get; set; }

        [Parameter("Support Color", DefaultValue = "Red")]
        public string SupportColor { get; set; }

        [Parameter("Resistance Color", DefaultValue = "DodgerBlue")]
        public string ResistanceColor { get; set; }


        protected override void Initialize()
        {
            if (TimeFrame <= TimeFrame.Hour)
                PivotTimeFrame = TimeFrame.Daily;
            else if (TimeFrame < TimeFrame.Daily)
            {
                PivotTimeFrame = TimeFrame.Weekly;
            }
            else
                PivotTimeFrame = TimeFrame.Monthly;


            Enum.TryParse(PivotColor, out pivotColor);
            Enum.TryParse(SupportColor, out supportColor);
            Enum.TryParse(ResistanceColor, out resistanceColor);

        }

        private DateTime GetStartOfPeriod(DateTime dateTime)
        {
            return CutToOpenByNewYork(dateTime, PivotTimeFrame);
        }

        private DateTime GetEndOfPeriod(DateTime dateTime)
        {
            if (PivotTimeFrame == TimeFrame.Monthly)
            {
                return new DateTime(dateTime.Year, dateTime.Month, 1).AddMonths(1);
            }

            return AddPeriod(CutToOpenByNewYork(dateTime, PivotTimeFrame), PivotTimeFrame);
        }

        public override void Calculate(int index)
        {

            var currentPeriodStartTime = GetStartOfPeriod(MarketSeries.OpenTime[index]);
            if (currentPeriodStartTime == _previousPeriodStartTime)
                return;

            if (index > 0)
                CalculatePivots(_previousPeriodStartTime, _previousPeriodStartIndex, currentPeriodStartTime, index);

            _previousPeriodStartTime = currentPeriodStartTime;
            _previousPeriodStartIndex = index;
        }

        private void CalculatePivots(DateTime startTime, int startIndex, DateTime startTimeOfNextPeriod, int index)
        {

            DateTime currentOpenTime = MarketSeries.OpenTime[index];
            DateTime today = DateTime.Now.AddDays(-1);

            // Only show output in todays timeframe
            if (OnlyLastDay && currentOpenTime.Date.Day != today.Date.Day)
                return;

            var high = MarketSeries.High[startIndex];
            var low = MarketSeries.Low[startIndex];
            var close = MarketSeries.Close[startIndex];
            var i = startIndex + 1;

            while (GetStartOfPeriod(MarketSeries.OpenTime[i]) == startTime && i < MarketSeries.Close.Count)
            {
                high = Math.Max(high, MarketSeries.High[i]);
                low = Math.Min(low, MarketSeries.Low[i]);
                close = MarketSeries.Close[i];

                i++;
            }

            var pivotStartTime = startTimeOfNextPeriod;
            var pivotEndTime = GetEndOfPeriod(startTimeOfNextPeriod);

            var pivot = (high + low + close) / 3;

            var r1 = pivot + (Fibo1 * (high - low));
            var s1 = pivot - (Fibo1 * (high - low));

            var r2 = pivot + (Fibo2 * (high - low));
            var s2 = pivot - (Fibo2 * (high - low));

            var r3 = pivot + (Fibo3 * (high - low));
            var s3 = pivot - (Fibo3 * (high - low));

            ChartObjects.DrawLine("pivot " + startIndex, pivotStartTime, pivot, pivotEndTime, pivot, pivotColor, 1, LineStyle.DotsVeryRare);
            ChartObjects.DrawLine("r1 " + startIndex, pivotStartTime, r1, pivotEndTime, r1, resistanceColor, 1, LineStyle.DotsRare);
            ChartObjects.DrawLine("r2 " + startIndex, pivotStartTime, r2, pivotEndTime, r2, resistanceColor, 1, LineStyle.Lines);
            ChartObjects.DrawLine("r3 " + startIndex, pivotStartTime, r3, pivotEndTime, r3, resistanceColor, 1, LineStyle.Solid);
            ChartObjects.DrawLine("s1 " + startIndex, pivotStartTime, s1, pivotEndTime, s1, supportColor, 1, LineStyle.DotsRare);
            ChartObjects.DrawLine("s2 " + startIndex, pivotStartTime, s2, pivotEndTime, s2, supportColor, 1, LineStyle.Lines);
            ChartObjects.DrawLine("s3 " + startIndex, pivotStartTime, s3, pivotEndTime, s3, supportColor, 1, LineStyle.Solid);

            if (!ShowLabels)
                return;

            ChartObjects.DrawText("Lpivot " + startIndex, "P", index, pivot, vAlignment, hAlignment, pivotColor);
            ChartObjects.DrawText("Lr1 " + startIndex, "R1", index, r1, vAlignment, hAlignment, resistanceColor);
            ChartObjects.DrawText("Lr2 " + startIndex, "R2", index, r2, vAlignment, hAlignment, resistanceColor);
            ChartObjects.DrawText("Lr3 " + startIndex, "R3", index, r3, vAlignment, hAlignment, resistanceColor);
            ChartObjects.DrawText("Ls1 " + startIndex, "S1", index, s1, vAlignment, hAlignment, supportColor);
            ChartObjects.DrawText("Ls2 " + startIndex, "S2", index, s2, vAlignment, hAlignment, supportColor);
            ChartObjects.DrawText("Ls3 " + startIndex, "S3", index, s3, vAlignment, hAlignment, supportColor);


        }


        private static DateTime CutToOpenByNewYork(DateTime date, TimeFrame timeFrame)
        {
            if (timeFrame == TimeFrame.Daily)
            {
                var hourShift = (date.Hour + 24 - 17) % 24;
                return new DateTime(date.Year, date.Month, date.Day, date.Hour, 0, 0, DateTimeKind.Unspecified).AddHours(-hourShift);
            }

            if (timeFrame == TimeFrame.Weekly)
                return GetStartOfTheWeek(date);

            if (timeFrame == TimeFrame.Monthly)
            {
                return new DateTime(date.Year, date.Month, 1, 0, 0, 0, DateTimeKind.Unspecified);
            }

            throw new ArgumentException(string.Format("Unknown timeframe: {0}", timeFrame), "timeFrame");
        }

        private static DateTime GetStartOfTheWeek(DateTime dateTime)
        {
            return dateTime.Date.AddDays((double)DayOfWeek.Sunday - (double)dateTime.Date.DayOfWeek).AddHours(-7);
        }


        public DateTime AddPeriod(DateTime dateTime, TimeFrame timeFrame)
        {
            if (timeFrame == TimeFrame.Daily)
            {
                return dateTime.AddDays(1);
            }
            if (timeFrame == TimeFrame.Weekly)
            {
                return dateTime.AddDays(7);
            }
            if (timeFrame == TimeFrame.Monthly)
                return dateTime.AddMonths(1);

            throw new ArgumentException(string.Format("Unknown timeframe: {0}", timeFrame), "timeFrame");
        }

    }

}
Leonardo.Ciaccio
Joined on 14.03.2018
- Distribution: Free
- Language: C#
- Trading platform: cTrader Automate
- File name: Fibo Pivot Points.algo
- Rating: 5
- Installs: 5527
- Modified: 13/10/2021 09:54
Comments
I have been told by a programmer that there is an issue with cTrader Pivots and unfortunately, it seems like it can't be solved.
Market Data Series containing candle stick info is what makes one able to draw a line on the chart representing the Pivot. There is no way to get a Market Data Series based candle in tick charts or any time-based chart below 1 minute and for this reason, there is no way to get the correct info on cAlgo API and draw correct Pivots on tick charts or any time-based charts below 1M.
Please let me know if you think you have a solution to this problem!!
Hi Leonardo,
It's a very good indicator but it doesn't draw weekly pivot lines on 4h time frame, only text.
Could you check it?

Hello , can you add the Price to the Levels? and also make a setting to show them on the right site of the chart?